Python monitoring tools
Python monitoring tools
Python has numerous monitoring tools that enable developers to monitor and analyze the performance of their applications. Some popular Python monitoring tools include:
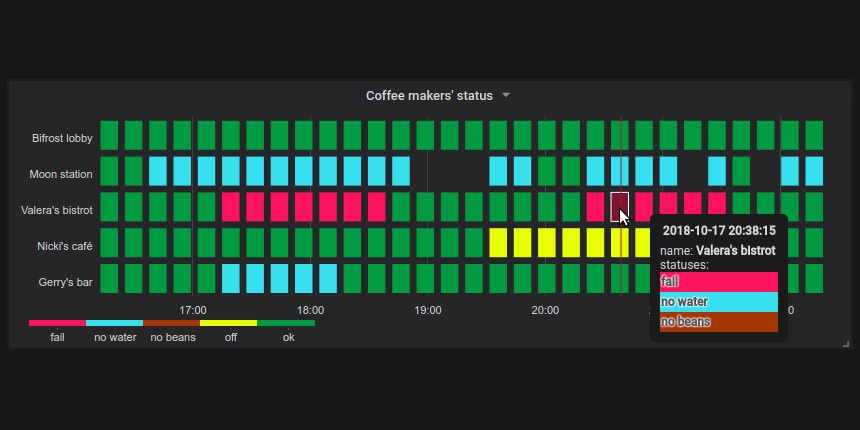
Datadog: Datadog is an all-in-one monitoring, analytics, and visualization platform for cloud-scale infrastructure and applications. It provides real-time insights into application performance, server health, and more. New Relic: New Relic provides a comprehensive monitoring solution that enables developers to monitor the performance of their Python applications in real-time. It offers detailed insights into application latency, database queries, and other key metrics. Prometheus: Prometheus is an open-source monitoring system that collects metrics from monitored targets by scraping data they expose via HTTP or using pushing metrics. It can be used with various storage backends including relational databases like PostgreSQL, Cassandra, MySQL, etc. Grafana: Grafana is a visualization tool for monitoring and analyzing the performance of your applications. It provides real-time insights into application performance, server health, and more through dashboards and alerts. Cronitor: Cronitor is an easy-to-use job runner that helps developers to schedule tasks in Python. It offers features like scheduling jobs, monitoring job logs, sending notifications for failures, and more. Mayan: Mayan is a powerful Python-based monitoring system. It provides real-time insights into application performance, server health, and more through dashboards and alerts. Splunk: Splunk is an all-in-one monitoring, analytics, and visualization platform that enables developers to monitor and analyze the performance of their applications in real-time. InfluxDB: InfluxDB is an open-source time-series database designed for managing large amounts of data with high write and read performance. It provides features like storage, filtering, grouping, etc. TimescaleDB: TimescaleDB is a time-series database written in PostgreSQL that enables developers to store and query large amounts of timestamped data efficiently. Opentsdb: OpenTSDB is a scalable, distributed, time-series database for storing and querying large amounts of monitoring data. It provides features like storage, filtering, grouping, etc. Apache Kafka: Apache Kafka is an open-source streaming platform that enables developers to build real-time data pipelines. It can be used with various tools including Prometheus, InfluxDB, and more. AWS CloudWatch: AWS CloudWatch is a cloud-based monitoring service that provides real-time insights into application performance, server health, and more through dashboards and alerts. Gogs: Gogs is a self-hosted Git service written in Go. It provides features like user management, repository management, issue tracking, etc. Sentry: Sentry is an open-source error tracker that helps developers to track errors in their applications. It provides features like error tracking, alerting, and more. Loggly: Loggly is a cloud-based logging service that enables developers to collect, monitor, and analyze log data from their applications. It provides real-time insights into application performance, server health, and more through dashboards and alerts.These Python monitoring tools provide features like real-time monitoring, alerting, and visualization, making it easy for developers to keep track of their application's performance and fix any issues that arise.
Python monitoring examples
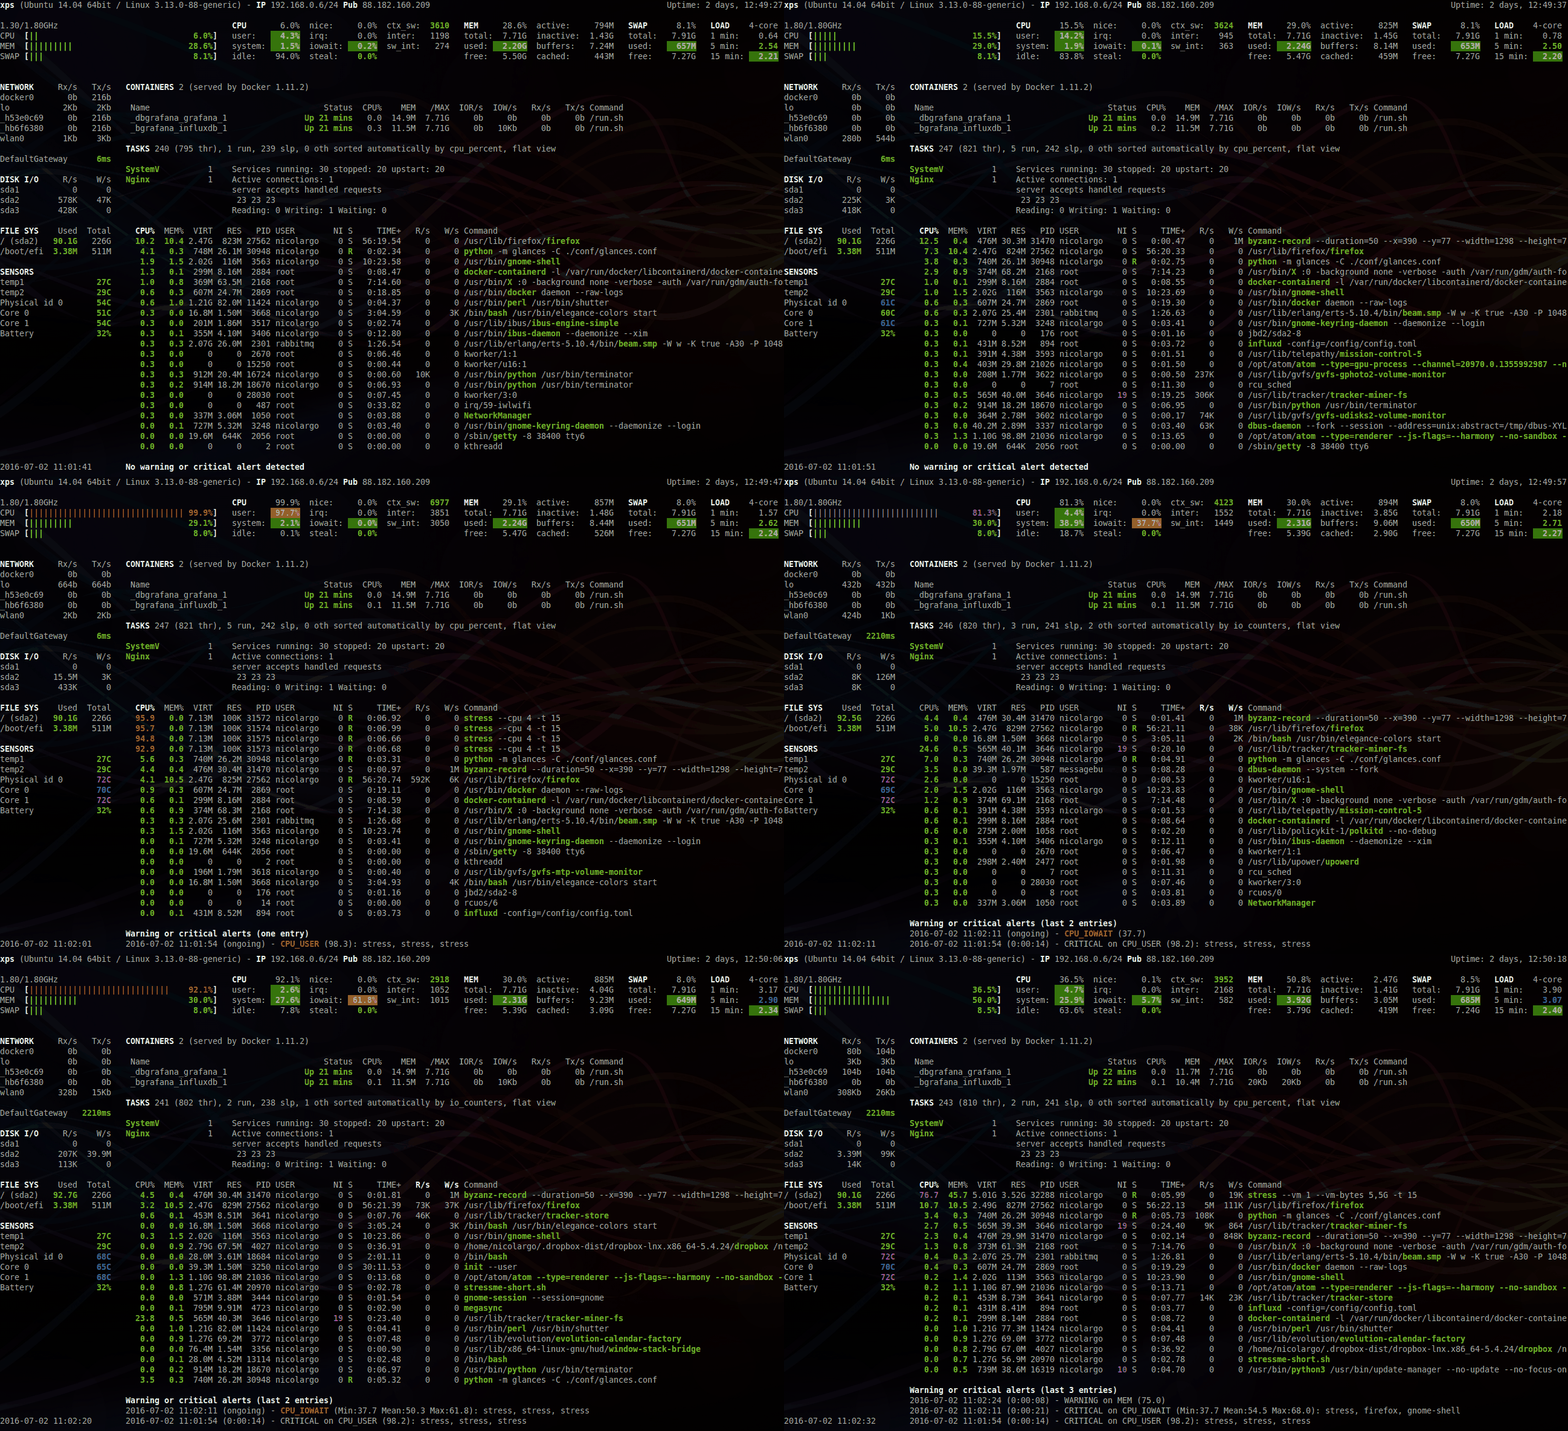
I apologize for the previous mistake. Here are some Python monitoring examples that demonstrate various techniques to monitor your system and applications:
1. CPU usage monitoring with psutil library:
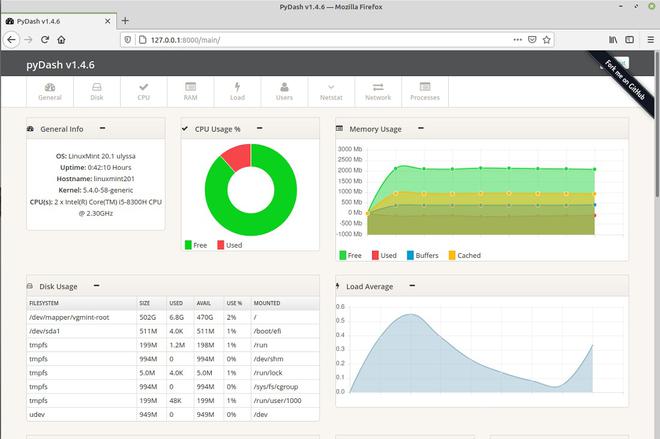
In this example, we use the psutil (process and system utilities) library to monitor CPU usage:
import psutilwhile True:
cpu_usage = psutil.cpu_percent(interval=1)
print(f"CPU usage: {cpu_usage}%")
time.sleep(1)
This script runs indefinitely, printing the current CPU usage percentage every second.
2. Memory monitoring with psutil library:
In this example, we use psutil to monitor memory usage:
import psutilwhile True:
mem_usage = psutil.virtual_memory().percent
print(f"Memory usage: {mem_usage}%")
time.sleep(1)
This script also runs indefinitely, printing the current memory usage percentage every second.
3. Disk I/O monitoring with psutil library:
In this example, we use psutil to monitor disk input/output (I/O) activity:
import psutilwhile True:
disk_io = psutil.disk_io_counters()
print(f"Disk reads: {disk_io.read_bytes}, Disk writes: {disk_io.write_bytes}")
time.sleep(1)
This script runs indefinitely, printing the current disk read and write byte counts every second.
4. Network monitoring with psutil library:
In this example, we use psutil to monitor network activity:
import psutilwhile True:
net_io = psutil.net_io_counters()
print(f"Bytes sent: {net_io.bytes_sent}, Bytes received: {net_io.bytes_recv}")
time.sleep(1)
This script runs indefinitely, printing the current bytes sent and received every second.
5. Log monitoring with logging module:
In this example, we use Python's built-in logging module to monitor log messages:
import logginglogging.basicConfig(level=logging.INFO)
while True:
for record in logging.getLogger().handlers[0].get_buffer_info()[1]:
print(record.getMessage())
time.sleep(1)
This script runs indefinitely, printing the current log messages every second.
These examples demonstrate various techniques to monitor your system and applications using Python. You can modify these scripts to suit your specific monitoring needs and integrate them into larger systems or applications.
