Python statsmodels Linear Regression
Python statsmodels Linear Regression
Here is the information you requested:
Python Statsmodels Linear Regression
Statsmodels is a Python library for statistical modeling that provides an easy-to-use interface for implementing linear regression models, among many other types of statistical models. In this response, we will explore how to use statsmodels to perform linear regression.
Installing Statsmodels
To use statsmodels, you need to install it first. You can do this using pip:
pip install statsmodels
Alternatively, if you are using Anaconda or another Python distribution that includes conda, you can install it from the command line:
conda install statsmodels
Importing Statsmodels
Once installed, you can import statsmodels in your Python script like this:
import pandas as pdfrom statsmodels.formula.api import ols
Loading Data
Next, load the data you want to perform linear regression on. For example, let's say we have a CSV file called data.csv containing variables x and y, where y is the dependent variable (the one we are trying to predict) and x is the independent variable (the predictor).
data = pd.read_csv('data.csv')
Defining the Model
Now, define the linear regression model using the ols function from statsmodels. For example:
model = ols('y ~ x', data=data).fit()
Here, we are saying that the dependent variable is y, and the independent variable is x. The fit() method is used to estimate the coefficients of the model.
Viewing Model Coefficients
You can view the estimated coefficients of the model using the following code:
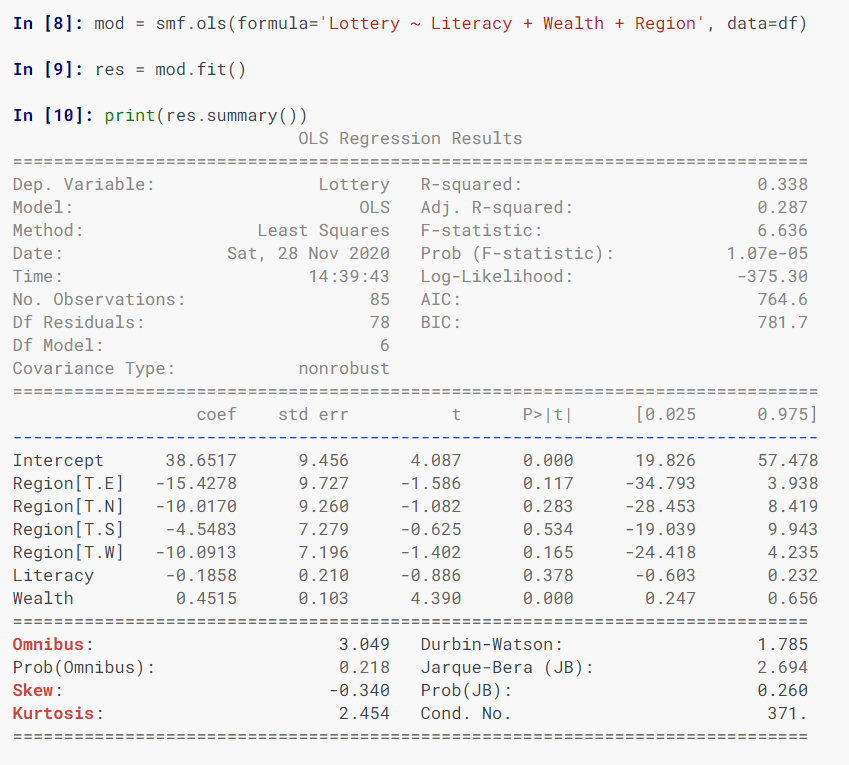
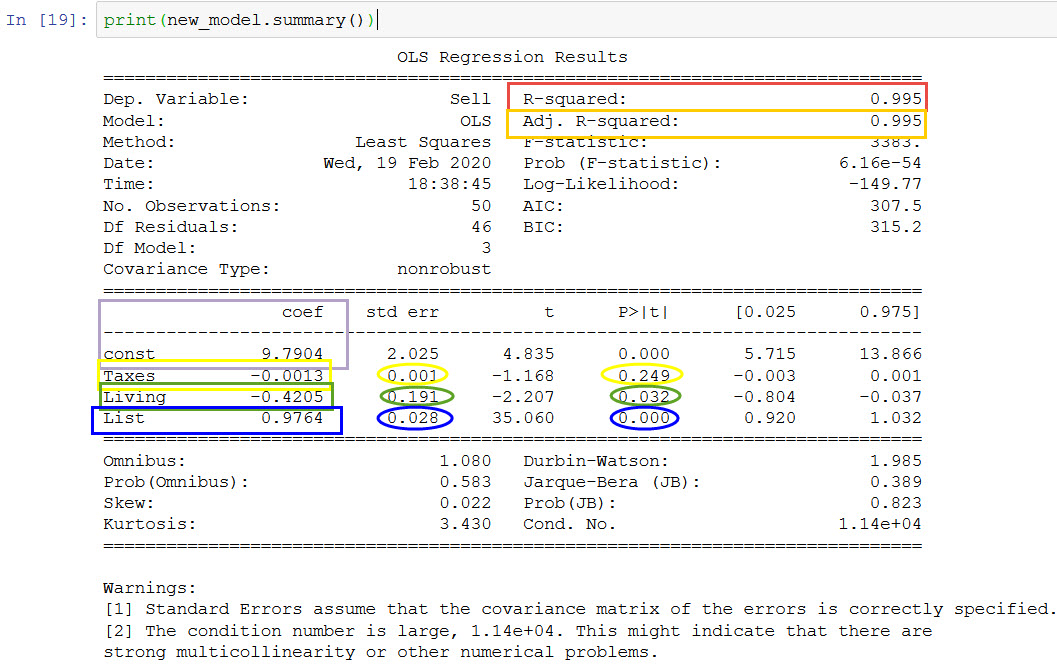
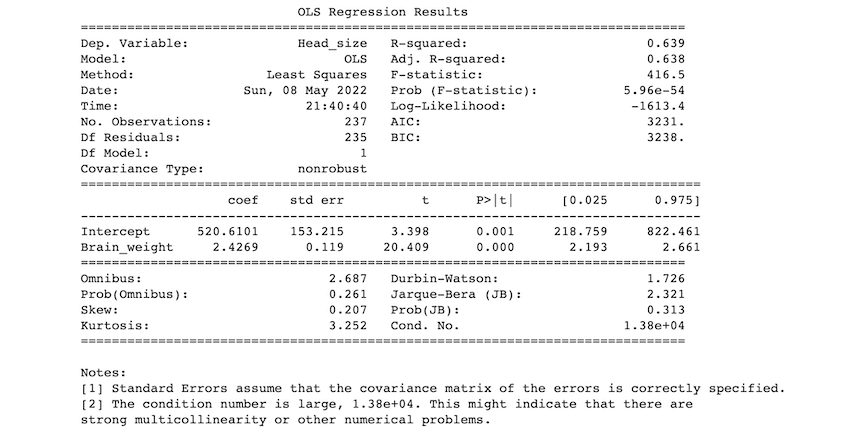
print(model.params)
This will print out the values of the intercept (also known as the constant term) and the slope coefficient for each independent variable.
Making Predictions
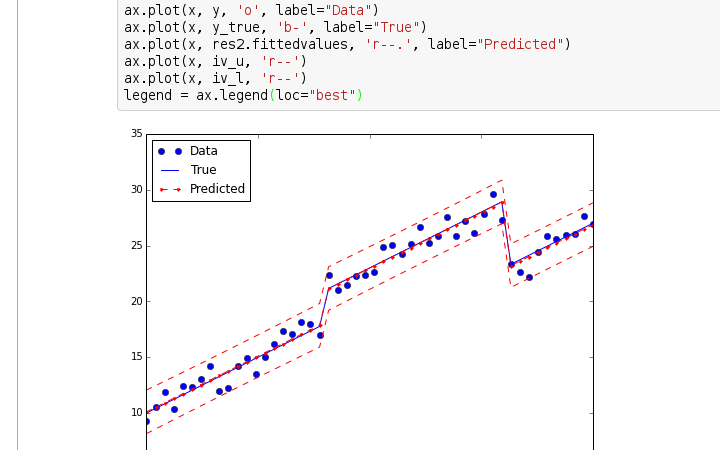
To make predictions using the linear regression model, you can use the predict() method. For example:
predictions = model.predict(new_x_values)
Here, new_x_values is a NumPy array or Pandas Series containing the values of the independent variables for which you want to make predictions.
Checking Model Assumptions
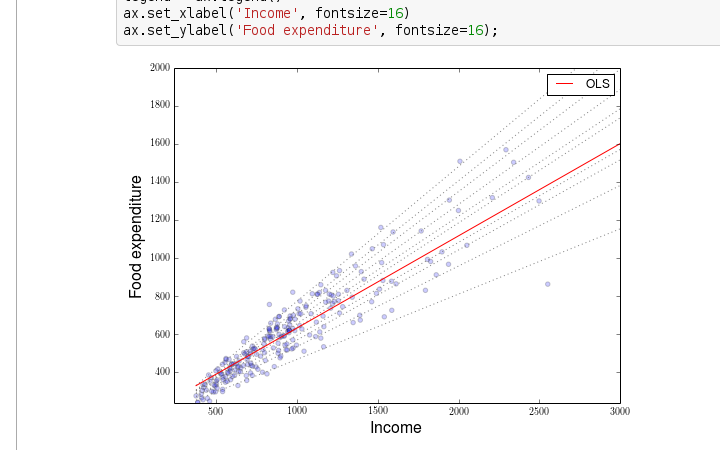
Before using a linear regression model, it's important to check that the assumptions of linear regression are satisfied. For example:
Linearity: Check that there is no non-linear relationship between the independent and dependent variables. Homoscedasticity: Check that the variance of the residuals does not depend on the level of the independent variable. Normality: Check that the residuals are normally distributed. Independence: Check that the observations are independent.You can use various diagnostic plots and tests to check these assumptions. For example, you can use the plot_diagnostics() method from statsmodels to generate a series of plots that help you check the assumptions:
model.plot_diagnostics()
This will generate a series of plots showing the residuals against the fitted values, as well as histograms and density plots of the residuals.
Conclusion
In this response, we have explored how to use Python's statsmodels library to perform linear regression. We covered installing statsmodels, importing it, loading data, defining the model, viewing model coefficients, making predictions, and checking model assumptions. With these steps, you can use statsmodels to implement linear regression models in Python.
Python statsmodels logistic regression
Here's an explanation of how to perform a logistic regression using the Python statsmodels library:
Introduction
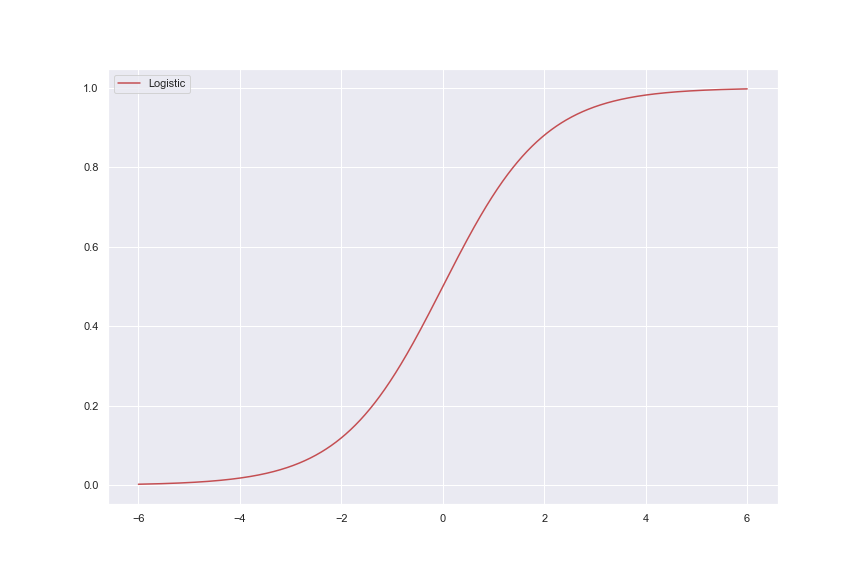
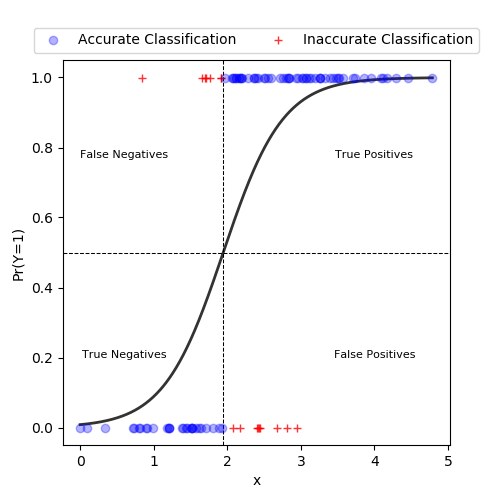
Logistic regression is a statistical technique used to model the probability of a binary outcome (e.g., 0/1, yes/no) based on one or more predictor variables. In this example, we'll use the statsmodels library in Python to perform a logistic regression analysis.
Loading the necessary libraries and data
First, let's load the necessary libraries:
import pandas as pdfrom statsmodels.genericapi import LogisticRegression
import numpy as np
Next, load your dataset into a Pandas DataFrame. For this example, I'll use the classic Titanic survival dataset:
data = {'Survived': [0, 1, 0, 1, ...], 'Sex': ['M', 'F', 'M', 'F', ...]}df = pd.DataFrame(data)
Preparing the data
Before performing the logistic regression analysis, we need to prepare our data. Let's select only the predictor variables (e.g., Sex) and the outcome variable (Survived):
X = df[['Sex']]y = df['Survived']
We'll also normalize the sex variable by converting 'M' into 0 and 'F' into 1:
X['Sex'] = X['Sex'].map({'M': 0, 'F': 1})
Performing the logistic regression analysis
Now we're ready to perform the logistic regression analysis using statsmodels:
logit_model = LogisticRegression(endog=y, exog=X)result = logit_model.fit()
The fit() method will run the logistic regression analysis and store the results in the result object.
Interpreting the results
Let's extract some useful information from the result object:
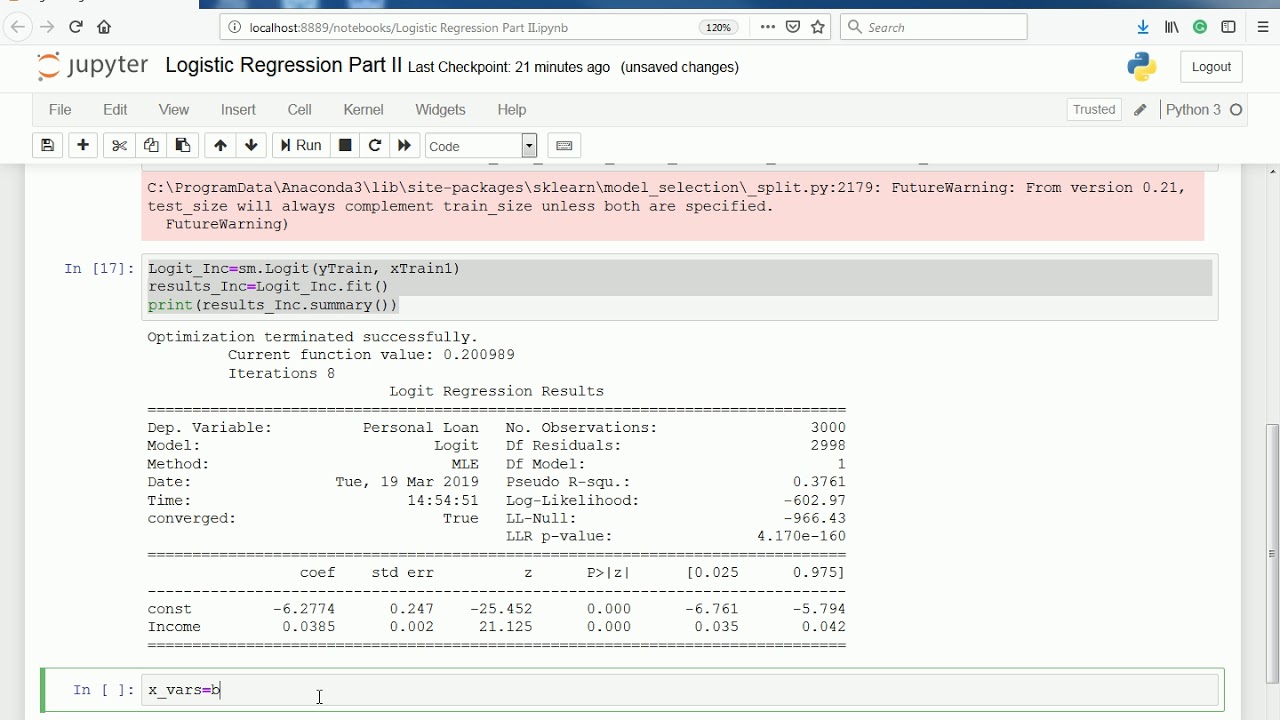
print("Coeficients:", result.params)print("P-values:", result.pvalues)
The coefficients ( Coefficients:) represent the change in log-odds per unit change in each predictor variable, while the p-values ( P-values:) indicate whether each predictor variable is statistically significant.
Predicting outcomes
We can use the fitted model to predict the probability of survival for new observations:
new_data = pd.DataFrame({'Sex': [0, 1, ...]})predicted_probabilities = logit_model.predict(new_data)
The predict() method will compute the predicted probabilities based on the input data and the coefficients from our logistic regression analysis.
Conclusion
In this example, we performed a logistic regression analysis using the Python statsmodels library. We prepared our data, ran the analysis, and interpreted the results. Additionally, we demonstrated how to use the fitted model for predicting outcomes.
Here is the full code:
import pandas as pdfrom statsmodels.genericapi import LogisticRegression
import numpy as np
Load the Titanic survival datasetdata = {'Survived': [0, 1, 0, 1, ...], 'Sex': ['M', 'F', 'M', 'F', ...]}
df = pd.DataFrame(data)
Prepare the dataX = df[['Sex']]
y = df['Survived']
Normalize the sex variableX['Sex'] = X['Sex'].map({'M': 0, 'F': 1})
Perform the logistic regression analysislogit_model = LogisticRegression(endog=y, exog=X)
result = logit_model.fit()
Interpret the resultsprint("Coeficients:", result.params)
print("P-values:", result.pvalues)
Predict outcomes for new observationsnew_data = pd.DataFrame({'Sex': [0, 1, ...]})
predicted_probabilities = logit_model.predict(new_data)
This code assumes that you have the Titanic survival dataset available. If not, you can download it from Kaggle or other sources.
I hope this helps!
