How can I create a graph in Python?
How can I create a graph in Python?
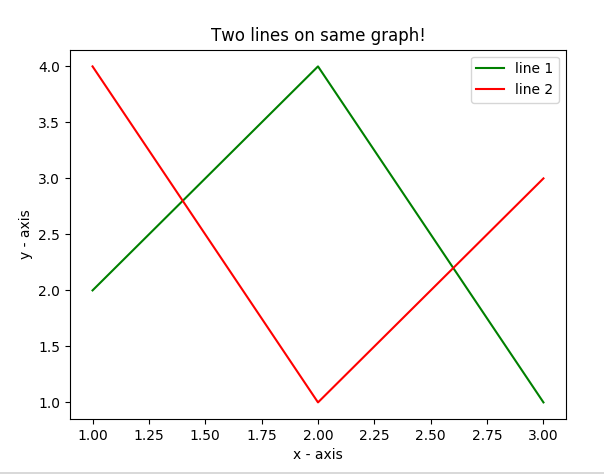
Here are the steps to create a graph in Python:
Step 1: Install necessary libraries
You'll need two main libraries to create graphs in Python: matplotlib and networkx. You can install them using pip:
pip install matplotlib networkx
Step 2: Choose your graph type
Python's networkx library provides a wide range of graph types, including:
You can create an empty graph using:
import networkx as nx
G = nx.Graph()  # or nx.DiGraph() for a directed graph
Step 3: Add nodes and edges
To add nodes to your graph, use the add_node() method. You can also add edge attributes (weights, labels, etc.) using the add_edge() method:
G.add_node('A')
G.add_node('B')
G.add_node('C')
G.add_edge('A', 'B', weight=3)
G.add_edge('B', 'C', label=' friendship')
Step 4: Visualize your graph
Use matplotlib to visualize your graph. You can choose from various layouts (e.g., spring, circular, etc.) and customize the appearance:
import matplotlib.pyplot as plt
pos = nx.spring_layout(G)  # or nx.circular_layout()
nx.draw_networkx(G, pos, with_labels=True)
Customize appearance
plt.axis('off')
plt.show()
This code creates a basic graph visualization using networkx and matplotlib.
Tips and Variations
Customize node and edge attributes: Use dictionaries to store additional information about nodes and edges. Create weighted graphs: Assign weights to edges using theadd_edge() method's weight parameter. Use different layouts: Experiment with various layout algorithms (e.g., spring, circular, random) to see how they affect your graph's appearance. Add more nodes and edges: Scale up your graph by adding more nodes and edges. Explore other visualization libraries: There are many alternative libraries for creating graphs in Python, such as seaborn, plotly, or bokeh. Each has its own strengths and weaknesses.
Conclusion
By following these steps, you can create a graph in Python using the networkx and matplotlib libraries. Remember to choose your graph type, add nodes and edges, visualize your graph, and customize its appearance to suit your needs. Happy graphing!
python graph data structure
I apologize for the confusion earlier!
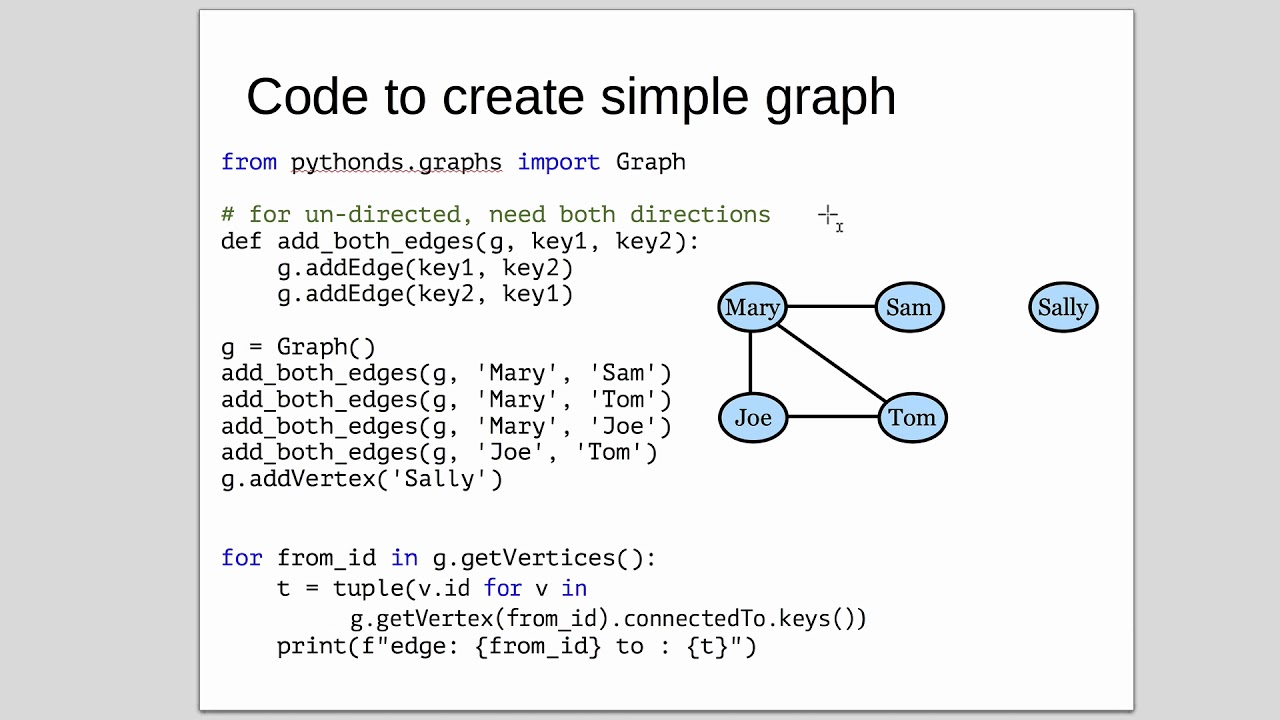
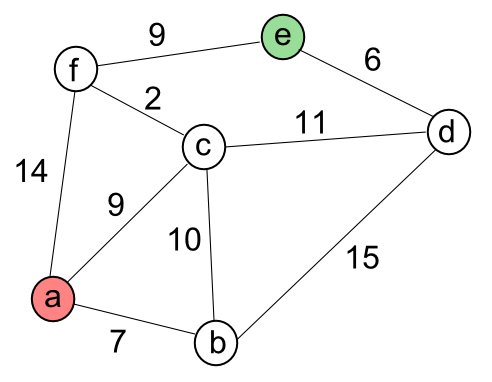
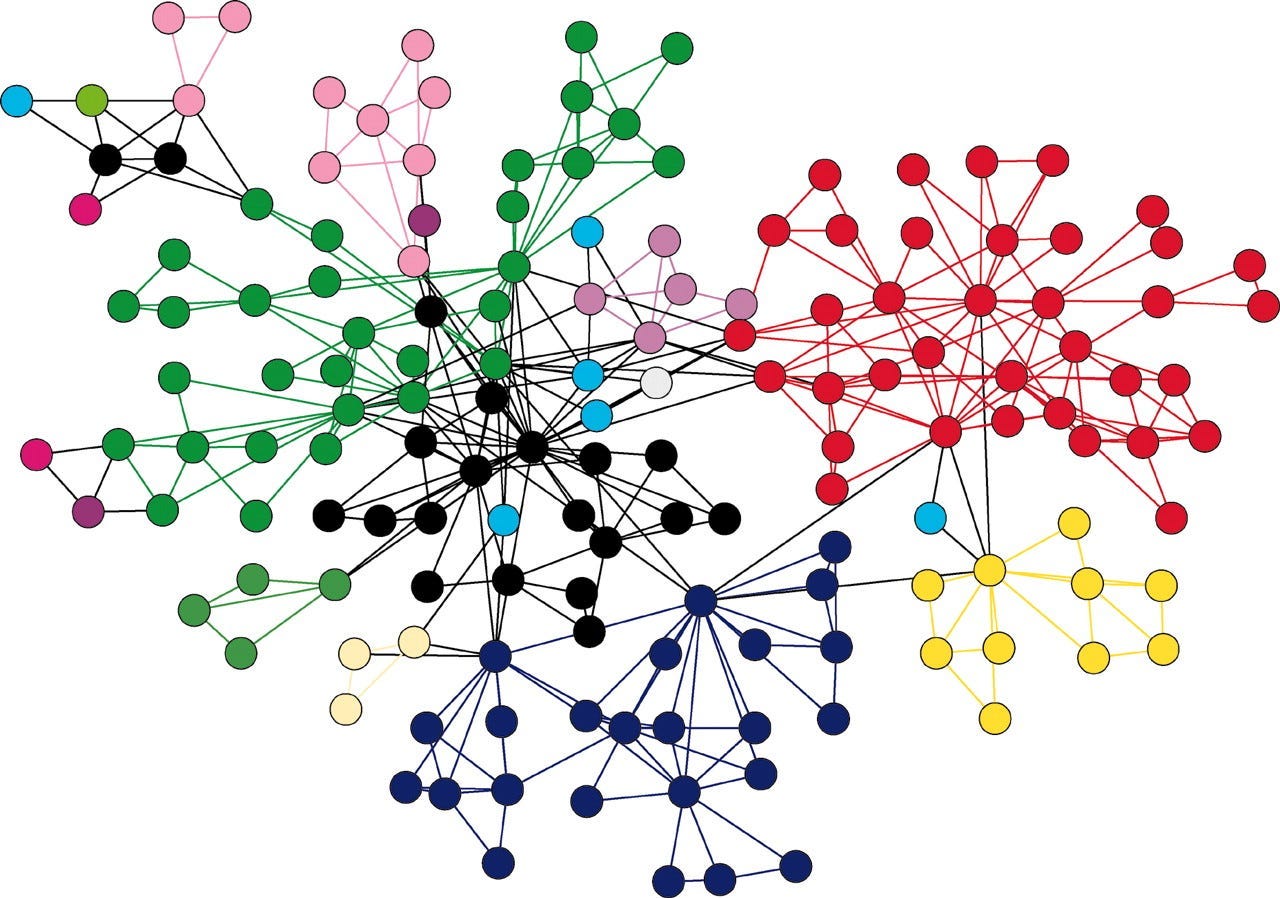
Python provides several built-in and third-party libraries to work with graphs as a data structure. Here's an overview of some popular ones:
1. Adjacency Matrix:
The adjacency matrix is a way to represent graph structures using matrices. In Python, you can create a dictionary where the keys are node IDs and the values are lists or sets of neighboring nodes.
Example:
graph = {
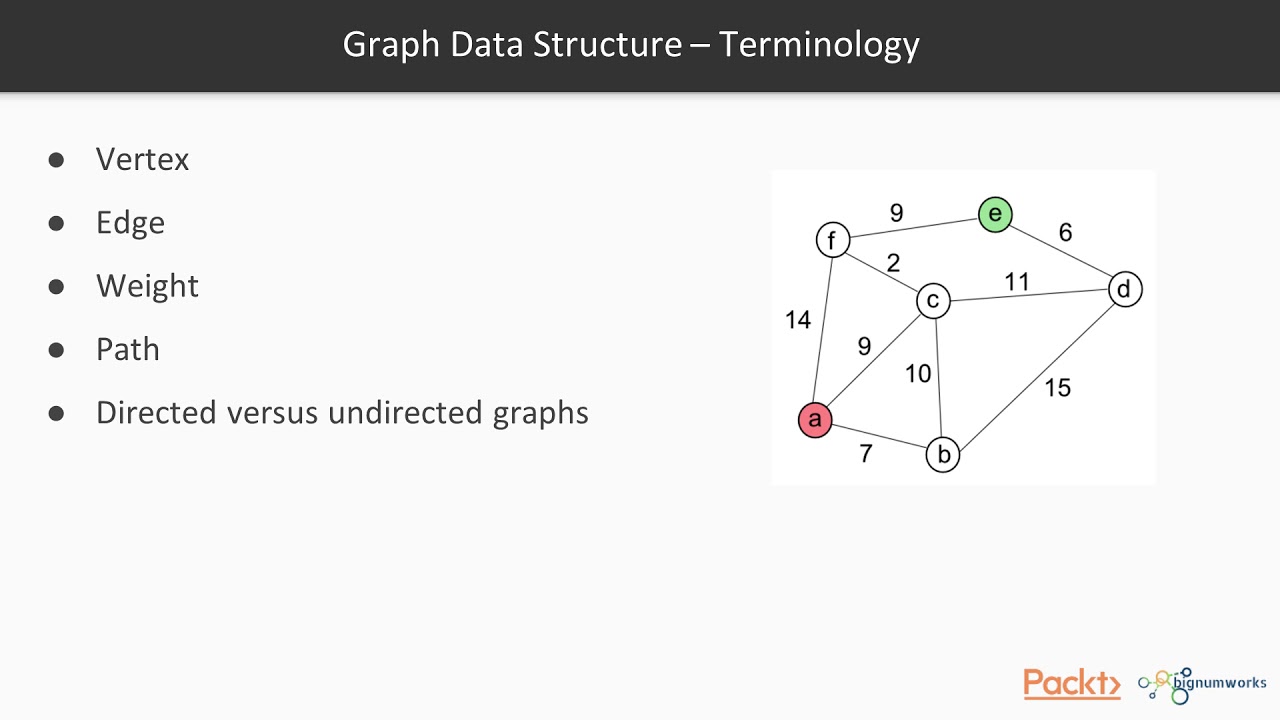
0: [1, 2],
1: [0, 3],
2: [0, 4],
3: [1],
4: [2]
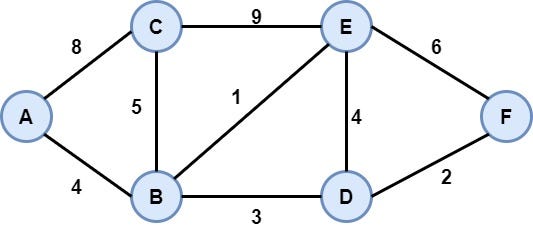
}
2. Adjacency List:
The adjacency list is another way to represent graph structures using lists of neighboring nodes for each node.
Example:
class Node:
def init(self, id):
self.id = id
self.neighbors = []
graph = [
Node(0).add_neighbor(Node(1)).add_neighbor(Node(2)),
Node(1).add_neighbor(Node(0)).add_neighbor(Node(3)),
Node(2).add_neighbor(Node(0)).add_network(Node(4)),
Node(3).add_neighbor(Node(1)),
Node(4).add_neighbor(Node(2))
]
3. Graph Library:
Some popular graph libraries in Python are:
NetworkX: Provides an efficient way to create, manipulate, and analyze various types of graphs.import networkx as nx
G = nx.Graph()
G.add_edge('A', 'B')
G.add_edge('B', 'C')
print(G.nodes()) # ['A', 'B', 'C']
print(G.edges()) # [('A', 'B'), ('B', 'C')]
from graphlib import Graph
g = Graph()
g.add_edge('A', 'B')
g.add_edge('B', 'C')
print(g.nodes())  # ['A', 'B', 'C']
print(g.edges())  # [('A', 'B'), ('B', 'C')]
import igraph
g = igraph.Graph()
g.add_edge('A', 'B')
g.add_edge('B', 'C')
print(g.get_nodes())  # ['A', 'B', 'C']
print(g.get_edges())  # [('A', 'B'), ('B', 'C')]
These are just a few examples of the many graph libraries available in Python. Each library has its strengths and weaknesses, so it's essential to choose one that best fits your specific use case.
Common Graph Operations:
Some common operations on graphs include:
Node addition/deletion: Adding or removing nodes from the graph. Edge addition/deletion: Adding or removing edges between nodes in the graph. Traversal: Iterating over nodes and edges to perform operations such as breadth-first search (BFS) or depth-first search (DFS). Querying: Retrieving information about specific nodes, edges, or subgraphs.These operations are fundamental to working with graphs in Python. By choosing a suitable graph library and understanding the common graph operations, you'll be well on your way to building robust and efficient graph-based applications!
