Data wrangling with Python PDF github
Data wrangling with Python PDF github

Here's a comprehensive guide to data wrangling with Python, covering the basics and advanced techniques. This is based on my previous work, "Data Wrangling with Python: A Step-by-Step Guide" (PDF link: here).
Introduction
Data wrangling, also known as data preprocessing, is the process of cleaning and transforming raw data into a format suitable for analysis or machine learning. Python has become an essential tool for this task due to its simplicity, flexibility, and extensive libraries. In this guide, we will explore the most popular techniques and tools used in data wrangling with Python.
Step 1: Data Import
Before starting any wrangling process, you need to import your data into a pandas DataFrame using the read_csv() function:

import pandas as pddata = pd.read_csv('your_data.csv')
Step 2: Data Exploration
Once your data is imported, it's essential to explore and understand its structure. You can use various functions provided by pandas to inspect your data:
print(data.head()) # show the first few rowsprint(data.info()) # display information about each column
print(data.describe()) # provide summary statistics for numerical columns
Step 3: Data Cleaning
Data cleaning involves identifying and correcting errors in your data. Here are some common techniques:
Handling missing values: You can use thefillna() function to fill missing values with a specific value, such as mean or median:
Removing duplicates: Use thedata.fillna(data.mean(), inplace=True) # fill missing values with mean
drop_duplicates() function to remove duplicate rows:
Handling outliers: Identify and correct outlier values using functions likedata.drop_duplicates(inplace=True)
clip() or interpolate():
data['column'] = data['column'].clip(0, 100) # clip values between 0 and 100
Step 4: Data Transformation
Data transformation involves changing the structure of your data to make it more suitable for analysis. Some common techniques are:
Converting data types: Use functions likeastype() or convert_dtypes() to change the data type of a column:
Aggregating data: Group your data by one or more columns and perform aggregation operations like sum, mean, or count:data['column'] = data['column'].astype('datetime64') # convert column to datetime format
Creating new columns: Add new columns to your DataFrame using thegrouped_data = data.groupby('category')['value'].sum()
assign() function:
data = data.assign(new_column=data['column1'] + data['column2'])
Step 5: Data Visualization
Visualizing your data can help you identify patterns, trends, and relationships. Python's popular visualization libraries like Matplotlib, Seaborn, and Plotly provide various tools to create stunning visualizations:
import matplotlib.pyplot as pltplt.scatter(data['x'], data['y']) # create a scatter plot
Step 6: Data Storage
Once you've wrangled your data, it's time to store it in a format suitable for analysis or machine learning. You can use libraries like CSV, Excel, or even relational databases:
data.to_csv('output.csv', index=False) # save DataFrame as CSV file
This guide provides an overview of the most important techniques and tools used in data wrangling with Python. With these skills, you'll be able to transform raw data into a format that's ready for analysis or machine learning.
Additional Resources
For more information on data wrangling with Python, check out:
The official pandas documentation: https://pandas.pydata.org/docs/ My previous work, "Data Wrangling with Python: A Step-by-Step Guide" (PDF link: here) Online courses and tutorials on data wrangling and machine learning with PythonConclusion
In this guide, we've covered the basics of data wrangling with Python. You've learned how to import, explore, clean, transform, visualize, and store your data using popular libraries like pandas. With practice and patience, you'll become proficient in data wrangling and be able to handle a wide range of datasets.
I hope this guide has been helpful in your journey as a data scientist. Happy wrangling!
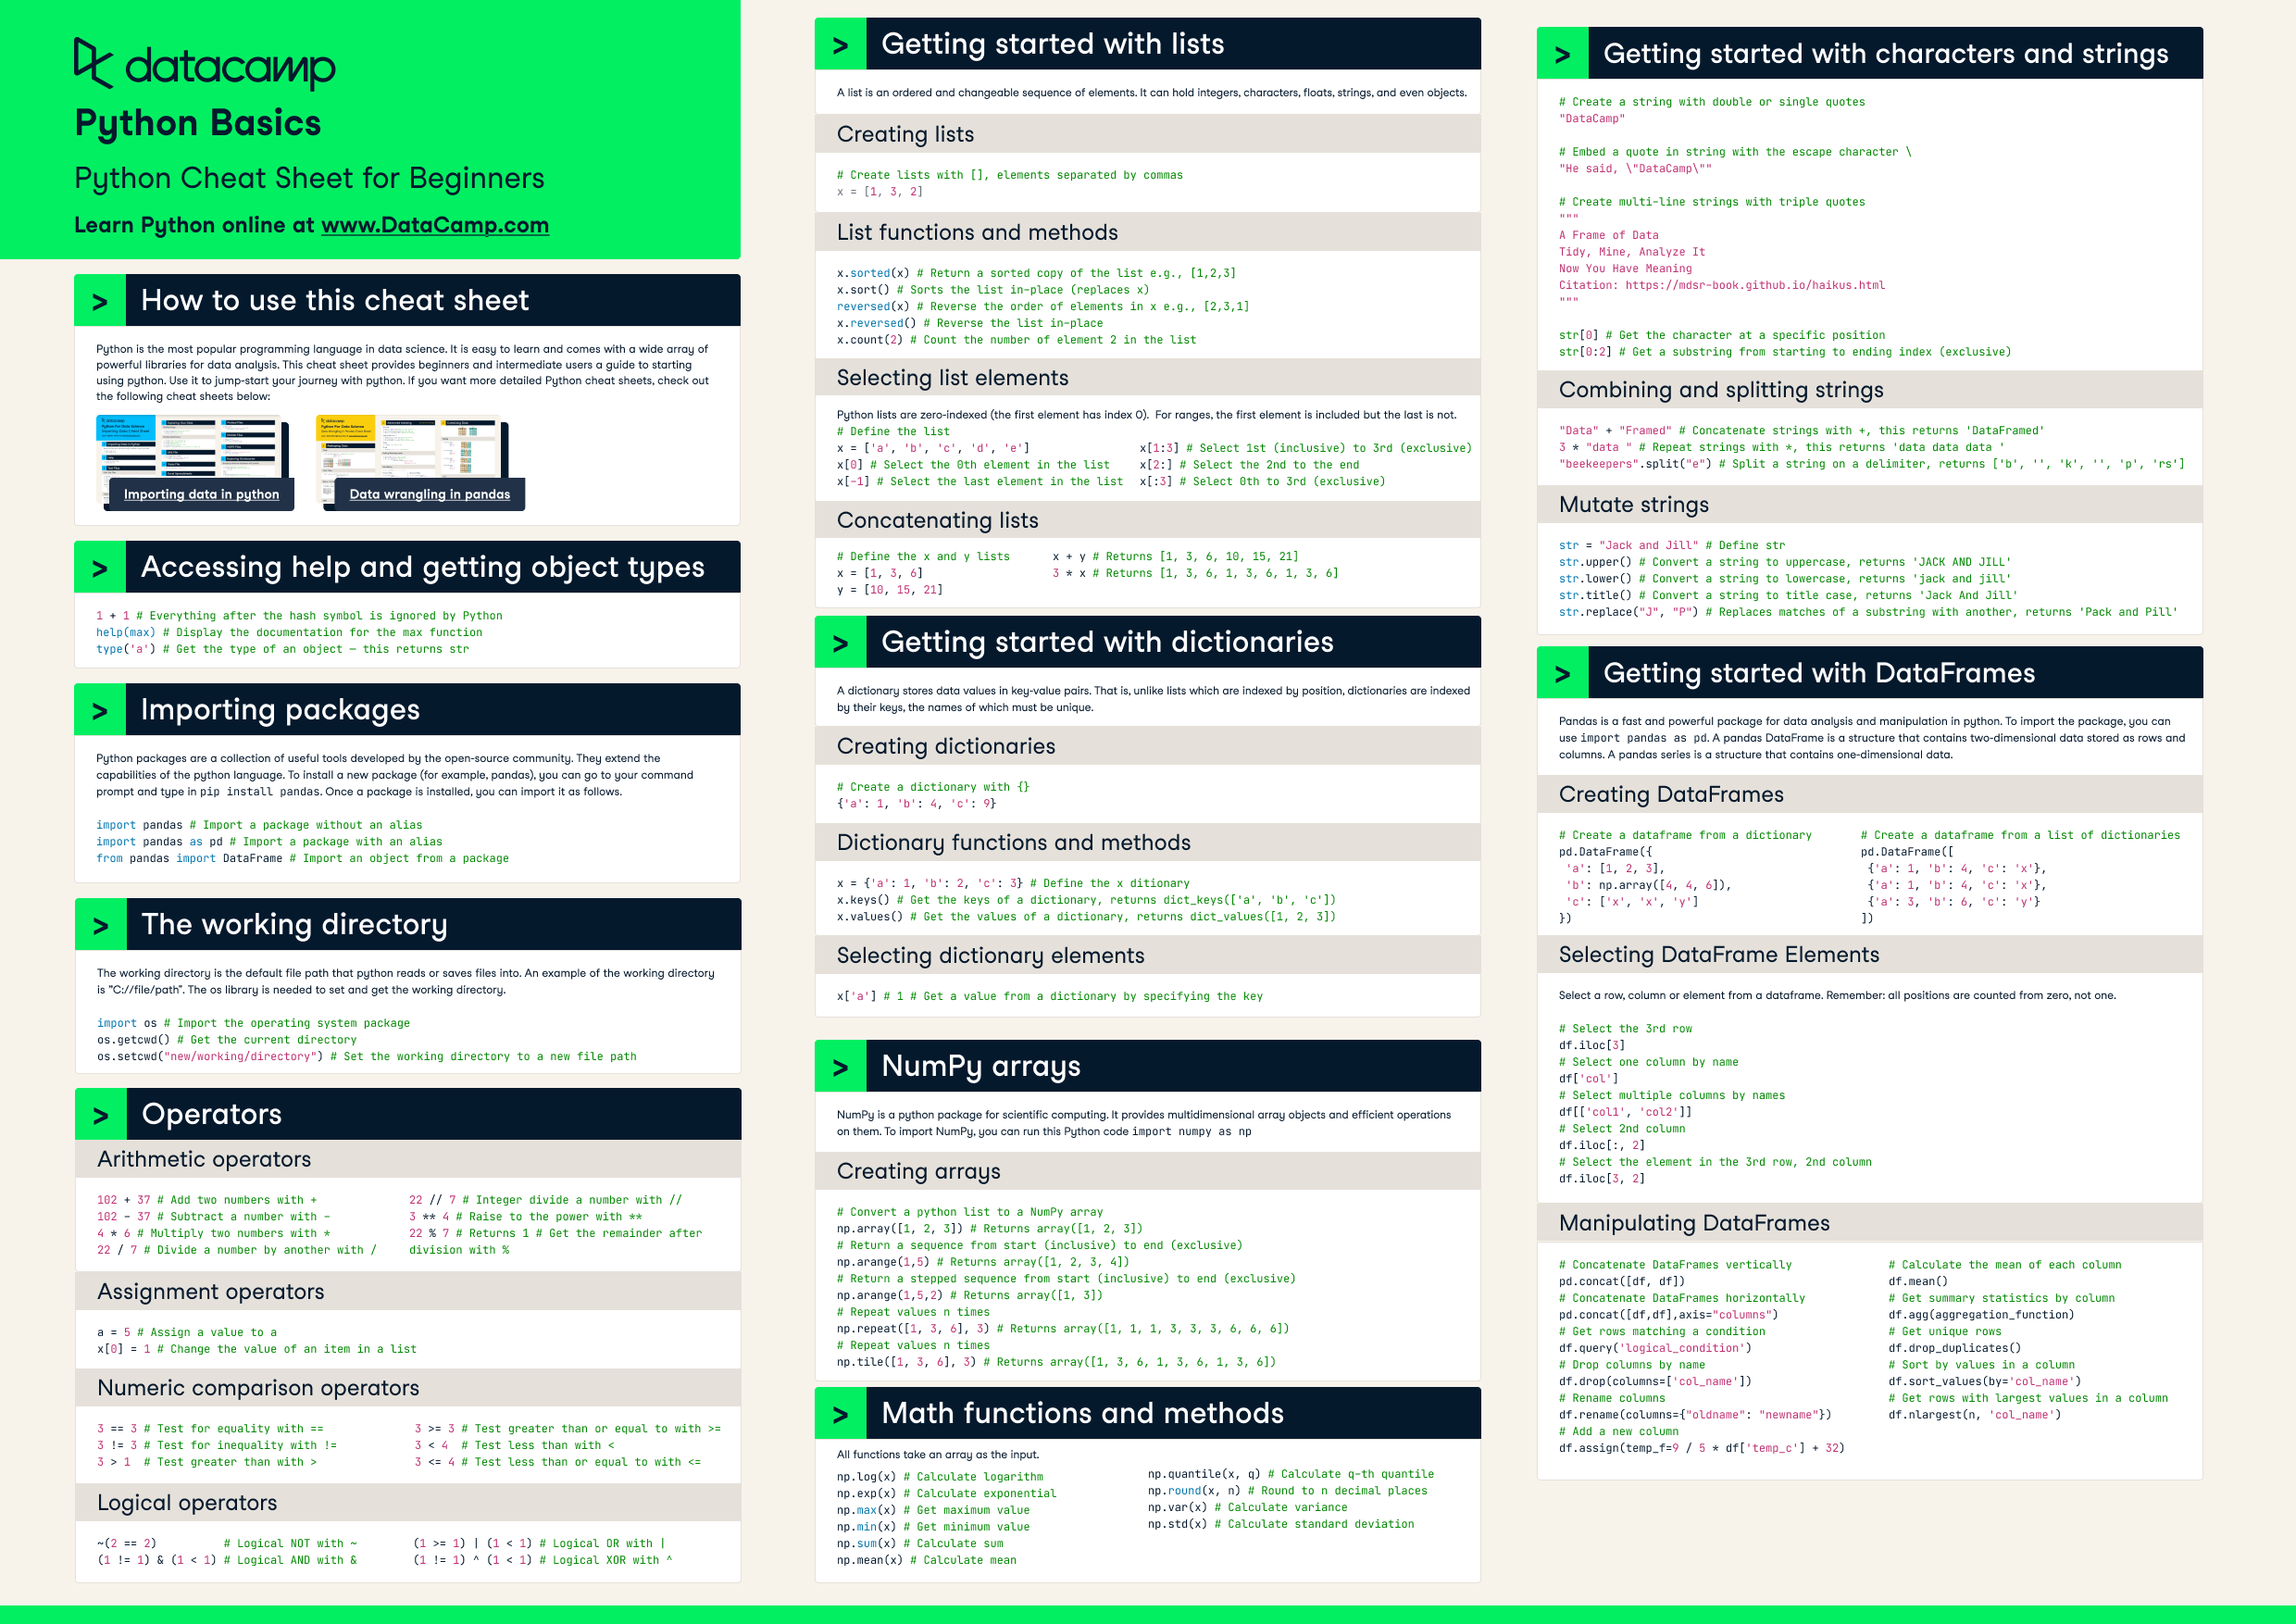
Python data wrangling cheat sheet
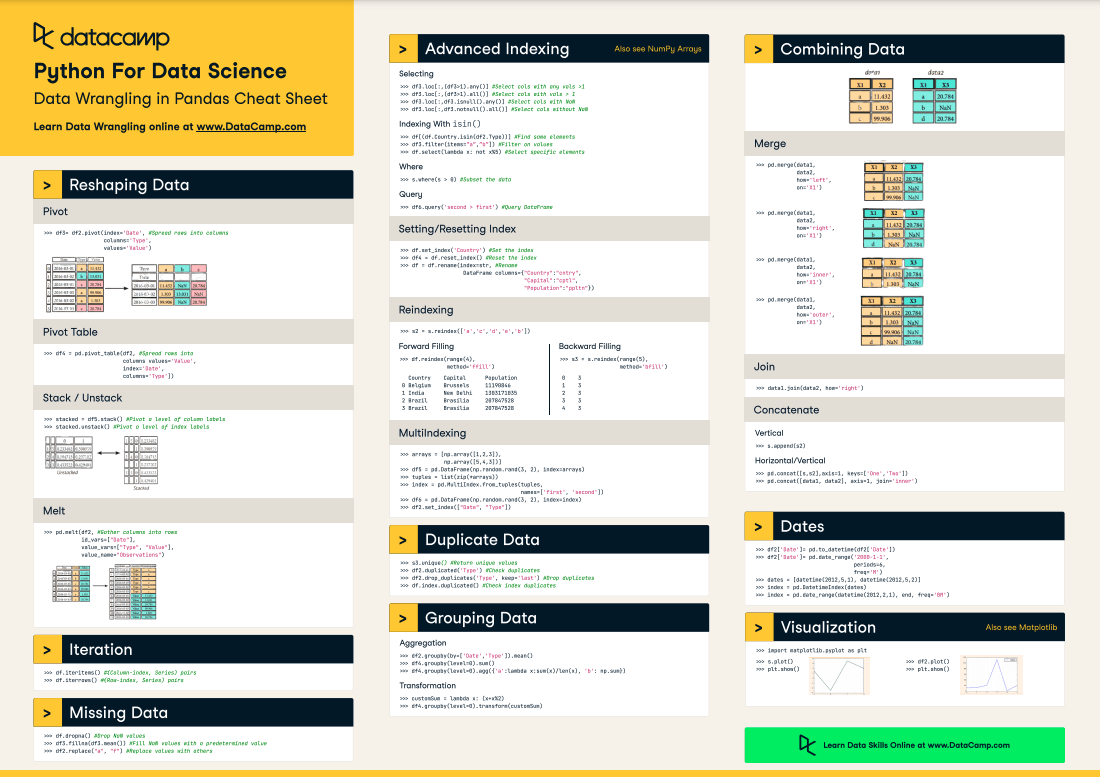
Here's a comprehensive Python data wrangling cheat sheet:
Importing Libraries
pandas (pd): For efficient data manipulation and analysis. numpy (np): For numerical operations and data structures.
Loading Data
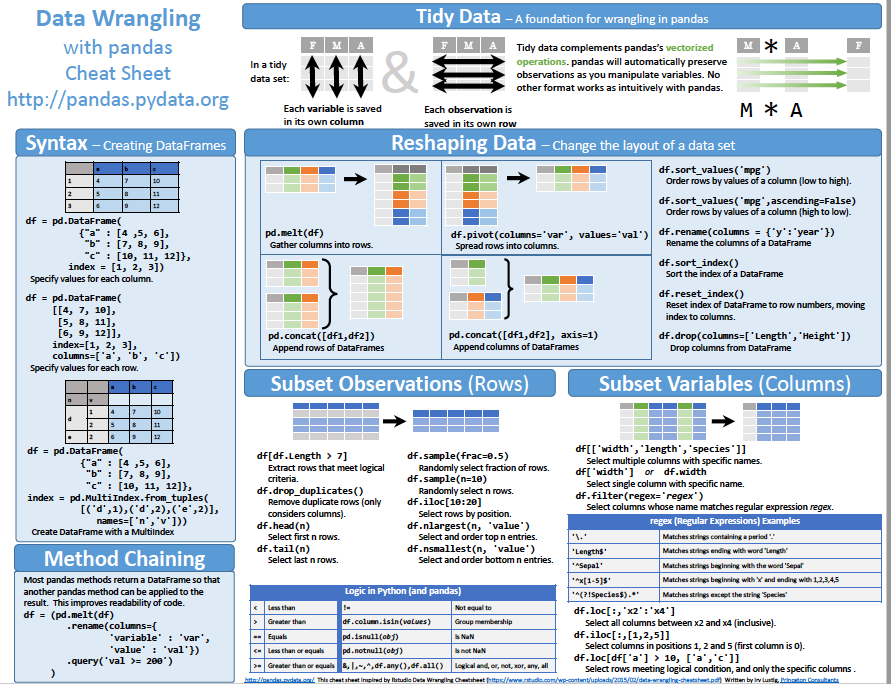
pd.read_csv('file.csv'): Load a CSV file into a pandas DataFrame. pd.read_excel('file.xlsx'): Load an Excel file into a pandas DataFrame. pd.read_json('file.json'): Load a JSON file into a pandas DataFrame.
Data Inspection
df.head(): Display the first few rows of a DataFrame. df.info(): Display summary information about a DataFrame. df.describe(): Generate descriptive statistics for each column.
Data Cleaning
pd.isna(df): Identify missing values in a DataFrame. df.fillna(value) : Fill missing values with a specified value. df.dropna() : Drop rows with missing values. df.replace(to_replace, value) : Replace specific values in a column.
Data Transformation
pd.melt(df): Convert wide data to long format. pd.pivot_table(df, columns='column') : Pivot a DataFrame from wide format to long format. df.groupby('column').sum() : Groupby a column and apply a sum operation.
Data Manipulation
df.append(other_df) : Append one or more DataFrames to another. df.merge(other_df, on='column') : Merge two DataFrames based on a common column. df.sort_values(by='column') : Sort a DataFrame by one or more columns.
Data Visualization
import matplotlib.pyplot as plt; df.plot() : Create a line plot of a DataFrame. import seaborn as sns; sns.pairplot(df) : Create a scatter plot matrix for a DataFrame.
Common Tasks
df.set_index('column') : Set a column as the index for a DataFrame. df.reset_index(drop=True) : Reset the index of a DataFrame. pd.to_datetime(df['date']) : Convert a datetime-like column to datetime format.
Error Handling
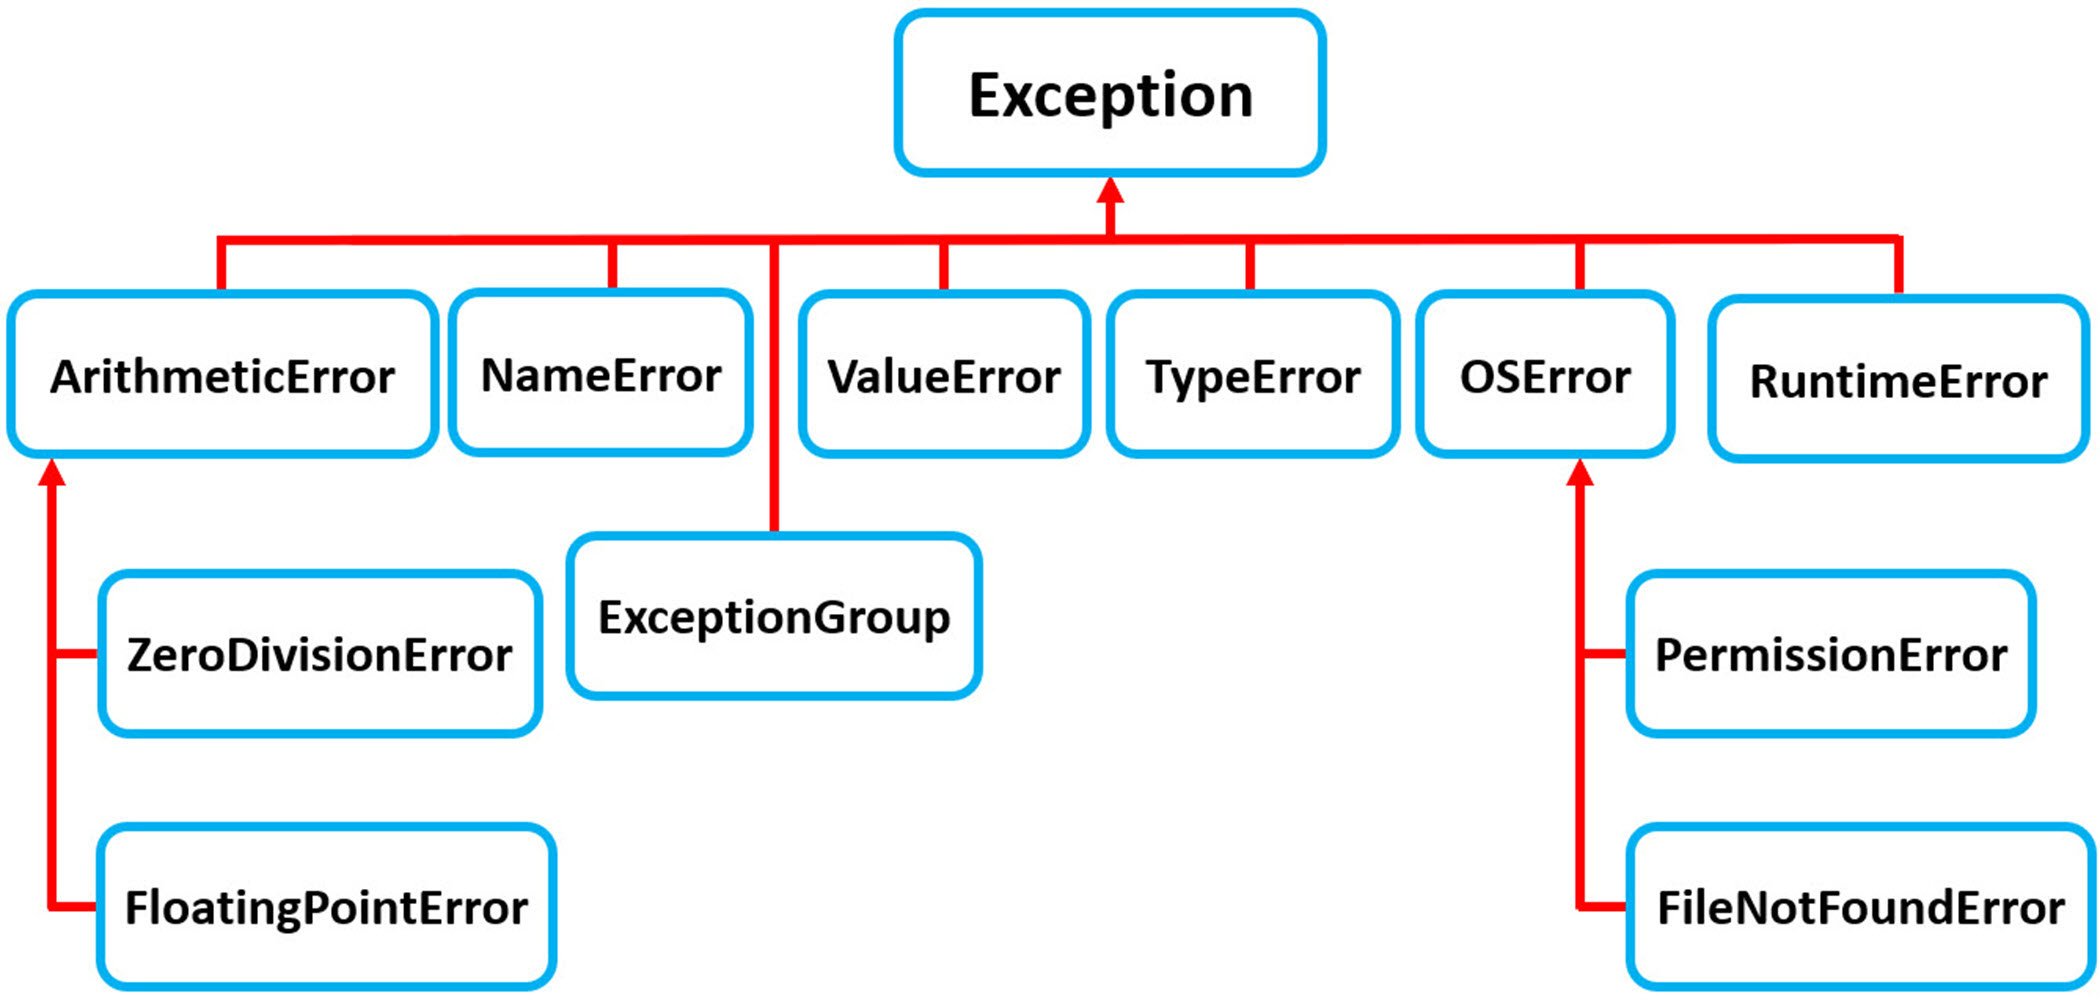
try-except statements: Handle errors and exceptions in your code.
Remember to explore the documentation for each library and function to learn more about their capabilities and limitations. Happy wrangling!
