Python matplotlib compiler
Python matplotlib compiler
Here's an overview of how to use the Python Matplotlib compiler:
What is Matplotlib?
Matplotlib is a Python plotting library that provides a wide range of tools for creating high-quality 2D and 3D plots, charts, and graphs. It is often used in conjunction with other data analysis and visualization libraries like NumPy, SciPy, and Pandas.
Why Use Matplotlib?
There are many reasons to use Matplotlib:
Easy to Learn: Matplotlib has a simple and intuitive API that makes it easy for beginners to get started. High-Quality Plots: Matplotlib produces high-quality plots with customizable layouts, fonts, and colors. Flexible: Matplotlib supports various plot types, such as line plots, scatter plots, bar charts, histograms, and more. Customizable: You can customize the appearance of your plots by adjusting parameters like font sizes, labels, titles, and colors.How to Use Matplotlib?
To use Matplotlib, you'll need to:
Install Python and Matplotlib: Install Python (version 3.x or later) and Matplotlib using pip:pip install matplotlib Import Matplotlib: In your Python script, import Matplotlib using import matplotlib.pyplot as plt Create a Figure: Create a figure using fig = plt.figure() or plt.figure(figsize=(width, height)) Add Data to the Plot: Use various plotting functions (e.g., plot, scatter, bar) to add data to your plot. Customize the Plot: Adjust parameters like font sizes, labels, titles, and colors using various options and methods. Display the Plot: Display the plot using plt.show() or save it as an image file using plt.savefig('filename.png')
Some Examples of Matplotlib Usage
Here are some simple examples of how you can use Matplotlib:
import matplotlib.pyplot as plt
import numpy as np
Create a line plot
x = np.linspace(0, 2 * np.pi, 100)
y = np.sin(x)
plt.plot(x, y)
plt.show()
Create a scatter plot
x = np.random.rand(100)
y = np.random.rand(100)
plt.scatter(x, y)
plt.show()
Create a bar chart
x = ['Jan', 'Feb', 'Mar']
y = [10, 20, 30]
plt.bar(x, y)
plt.show()
Conclusion
Matplotlib is an incredibly powerful and flexible plotting library that can help you create stunning data visualizations with ease. With its simple API, high-quality plots, and customizable options, Matplotlib is the perfect tool for anyone looking to visualize their data.
If you're new to Python or plotting in general, I recommend starting with some basic tutorials and examples to get a feel for how Matplotlib works. Once you're comfortable with the basics, you can start experimenting with more advanced features like 3D plots, animations, and custom plot layouts.
I hope this helps!
How do I install matplotlib in Python?
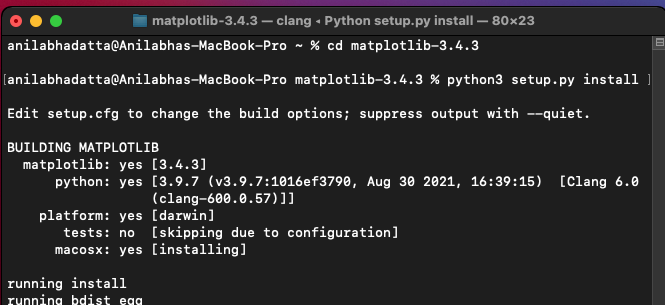
Installing Matplotlib in Python is a straightforward process that can be completed with just a few simple steps. Here's a step-by-step guide on how to install Matplotlib:
Prerequisites:
Python: You need to have Python installed on your system. If you don't have Python installed, you can download the latest version from the official Python website. pip: pip is the package installer for Python. It's usually included with Python installations.Step 1: Install Matplotlib using pip
Open a terminal or command prompt and type the following command:
pip install matplotlib
This will start installing Matplotlib and its dependencies. Depending on your internet connection, this may take a few seconds to several minutes.
Step 2: Verify the installation (optional)
If you want to verify that Matplotlib has been installed successfully, you can open a new Python interpreter or IDE (Integrated Development Environment) like PyCharm, Visual Studio Code, or Spyder. Then, type:
import matplotlib.pyplot as pltprint(plt.version)
This should print the version number of Matplotlib, indicating that it has been installed correctly.
Alternative installation methods:
If you're using a Linux-based system (like Ubuntu or Fedora) or macOS, you can also install Matplotlib using package managers like apt-get or homebrew. For example:
sudo apt-get install python3-matplotlib # (Ubuntu-based systems)
or
brew install matplotlib # (macOS using Homebrew)
Troubleshooting tips:
Error messages: If you encounter errors during installation, make sure that pip is updated to the latest version by runningpip install --upgrade pip. Dependency issues: Some users may experience dependency issues while installing Matplotlib. You can try upgrading the required dependencies using pip install --upgrade numpy scipy before attempting to reinstall Matplotlib. Python version compatibility: Matplotlib supports Python 3.6 and later versions. If you're using an earlier version of Python, you might need to upgrade or use a compatible version.
Conclusion:
Installing Matplotlib in Python is a breeze! By following these simple steps, you should be able to get started with creating stunning visualizations and data-driven insights. Remember to verify the installation (if you're curious) and troubleshoot any issues that may arise during the process. Happy plotting!
