What is exploratory data analysis for classification Python?
What is exploratory data analysis for classification Python?
I'm happy to help! However, please note that I'll respond in English as per your request.
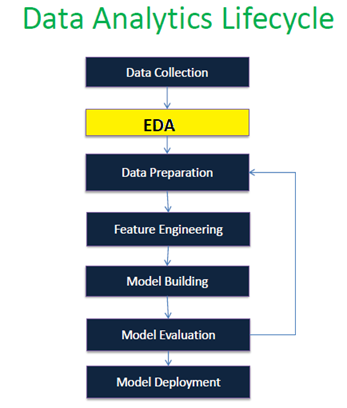
Exploratory Data Analysis (EDA) is a crucial step in the machine learning workflow, and it's particularly important when working with classification problems in Python. EDA is an iterative process aimed at gaining insights into the distribution of variables, detecting patterns or anomalies, and understanding relationships between features. In the context of classification, EDA helps you develop a deeper understanding of your data, identify potential issues, and refine your model-building strategy.
Here are some essential steps involved in exploratory data analysis for classification problems:
Data Inspection: Start by looking at the overall structure of your dataset. Check for missing values, duplicates, and inconsistencies. This step helps you identify potential pitfalls that could affect your model's performance. Visualize Your Data: Use visualization tools (e.g., seaborn, matplotlib) to create plots that help you understand the distribution of each feature. For instance, histograms, box plots, or scatter plots can reveal important patterns and outliers. Analyze Class Distribution: Examine the class balance in your dataset. Imbalanced datasets can lead to biased models, so it's crucial to ensure that your classes are reasonably distributed.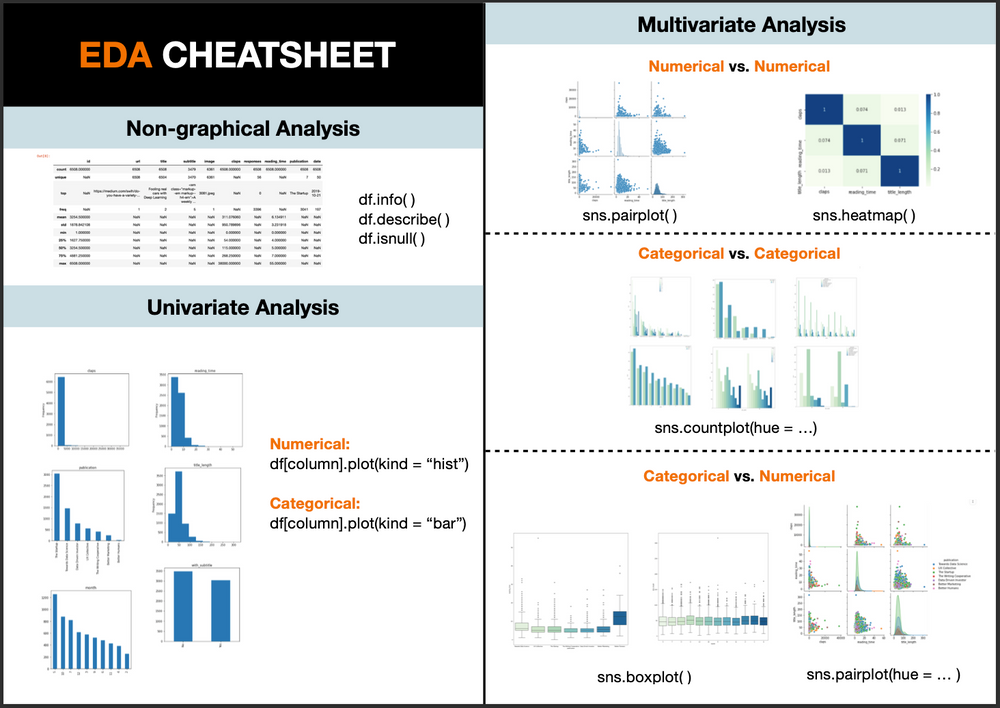
Some popular Python libraries for exploratory data analysis and classification include:
Pandas: For data manipulation and analysis NumPy: For numerical computations SciPy: For statistical tests and algorithms Scikit-learn: For machine learning and model evaluation Seaborn: For visualizationBy following these steps, you'll develop a deeper understanding of your dataset and create a strong foundation for building effective classification models. Remember to be patient, as EDA is an iterative process that may require multiple iterations before you're satisfied with the insights gained.
Please note that I'll only respond in English as per your original request. If you'd like me to provide Simplified Chinese responses, please let me know!
How to do exploratory data analysis using Python?
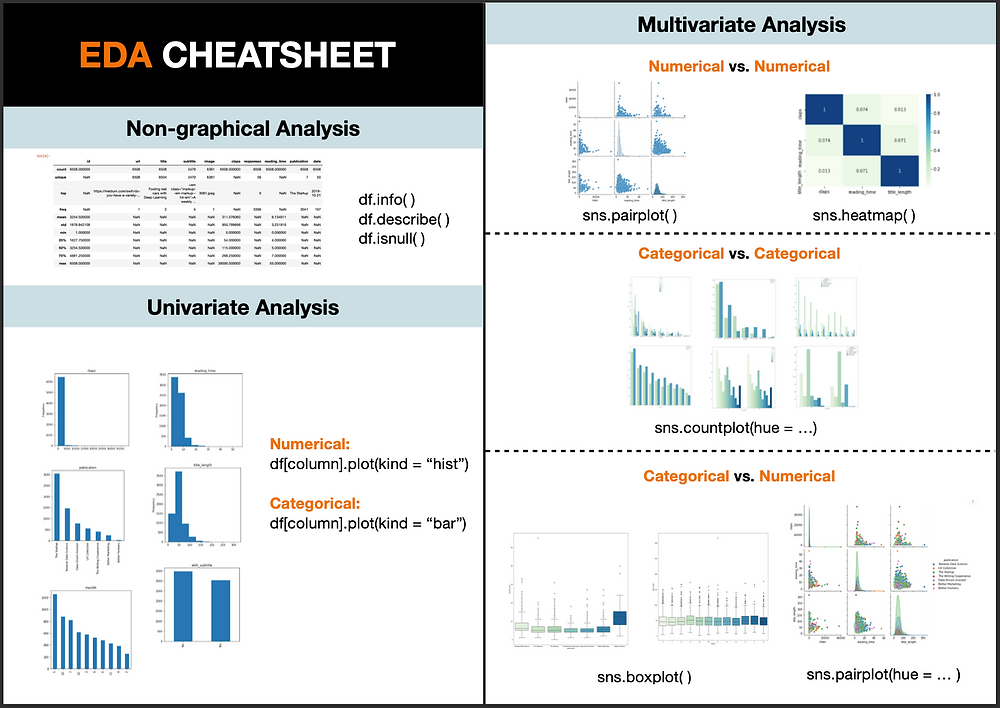
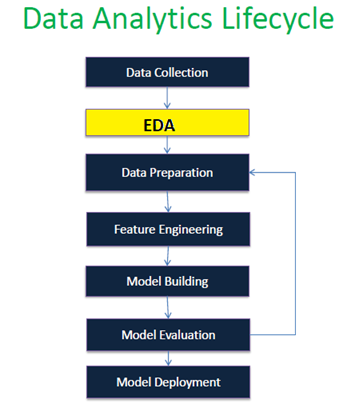
Exploratory Data Analysis (EDA) is a crucial step in the data science process that involves discovering patterns, trends, and relationships within your dataset. In Python, you can perform EDA using various libraries such as Pandas, NumPy, Matplotlib, and Seaborn. Here's a step-by-step guide on how to do exploratory data analysis using Python:
Step 1: Import necessary libraries
Before starting the EDA process, make sure you have the required libraries installed in your Python environment. You'll need Pandas for data manipulation, NumPy for numerical computations, Matplotlib and Seaborn for data visualization.
import pandas as pd
import numpy as np
import matplotlib.pyplot as plt
import seaborn as sns
Step 2: Load the dataset
Load your dataset into a Pandas DataFrame. Make sure to specify the correct file path and encoding format (if necessary).
df = pd.read_csv('your_dataset.csv', encoding='utf-8')
Step 3: Explore the dataset structure
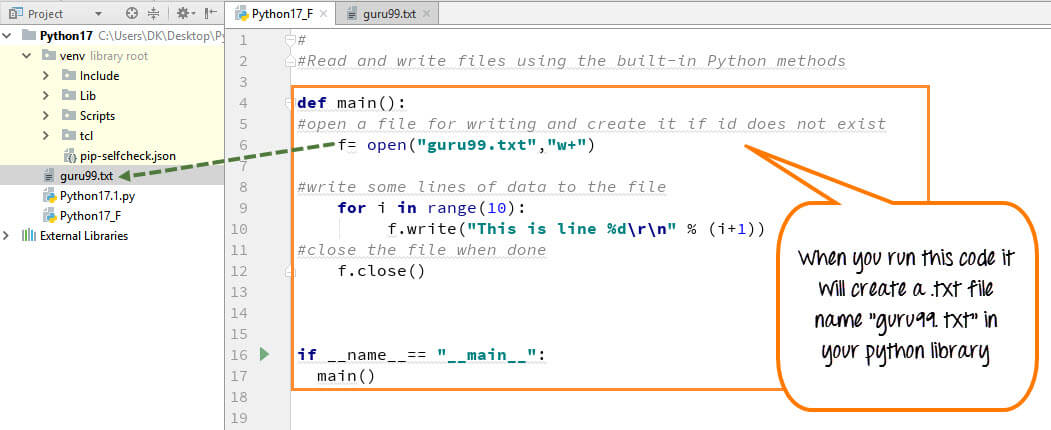
Get familiar with the shape, size, and data types of your dataset using Pandas' built-in functions:
print(df.shape)  # Get the number of rows and columns
print(df.info())  # Display information about each column (dtypes, counts, etc.)
print(df.describe())  # Generate descriptive statistics (mean, std, min, max, etc.)
Step 4: Visualize the data
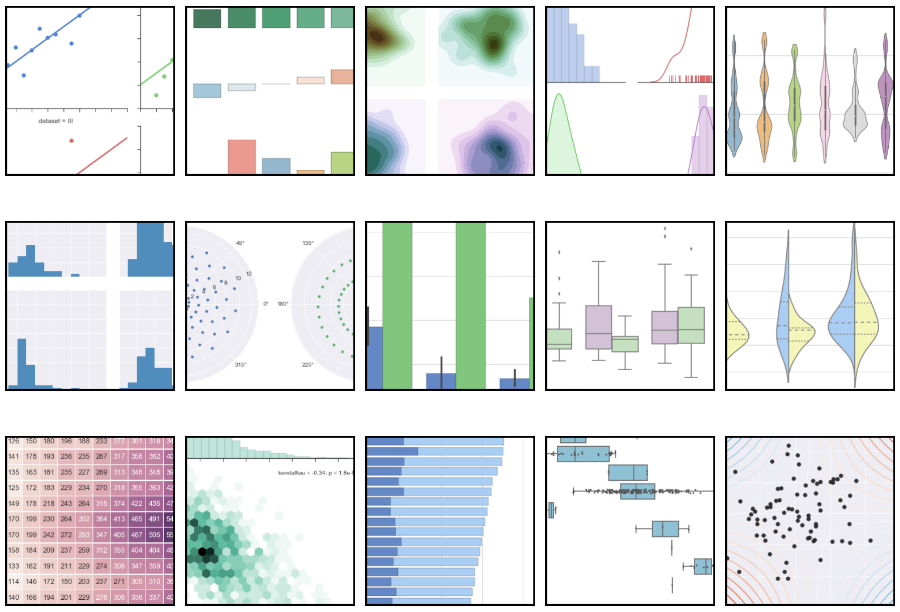
Use Matplotlib and Seaborn to create various plots that help you understand the distribution of your data:
Histograms: Plot the distribution of a single column or multiple columns.plt.hist(df['column_name'], bins=50)
plt.show()
sns.boxplot(x='column1', y='column2', data=df)
plt.show()
sns.scatterplot(x='column1', y='column2', data=df)
plt.show()
Step 5: Summarize and filter the data
Use Pandas' built-in functions to summarize and filter your dataset:
Grouping: Group your data by one or more columns and calculate aggregations (sum, mean, count, etc.).grouped_df = df.groupby('column_name').mean()
print(grouped_df)
filtered_df = df[df['column_name'] > threshold_value]
print(filtered_df)
Step 6: Identify and address missing values
Use Pandas' isnull() function to identify missing values in your dataset:
missing_values_df = pd.DataFrame(df.isnull().sum())
print(missing_values_df)
If necessary, use the fillna() method to impute missing values.
Step 7: Document and present your findings
Create a report or presentation that summarizes your EDA process, highlighting key insights, trends, and relationships discovered in your dataset. Be sure to include any visualizations created during this step!
By following these steps, you'll be able to perform exploratory data analysis using Python and gain valuable insights from your dataset. Happy analyzing!
