Python tree visualization interactive
Python tree visualization interactive
Here is a comprehensive overview of python libraries for creating an interactive tree visualization:
Python offers numerous libraries for visualizing hierarchical data structures, such as trees, decision trees, and clustering results. Here are some popular options:
Plotly: Plotly is one of the most widely used Python data visualization libraries. It supports interactivity, including hover-over text, zooming, panning, and clicking on nodes to retrieve additional information.To create a tree visualization with Plotly, you can use the treemap() function from its graph_objs module. This library provides various options for customizing the appearance of your tree, such as node colors, shapes, and sizes.
Example:
import plotly.graph_objects as go
Define tree data structure (nested dictionaries)
tree_data = {
'A': {'children': ['B', 'C']},
'B': {'children': ['D', 'E']},
'C': {'children': ['F', 'G']},
'D': {'children': ['H', 'I']},
'E': {'children': ['J', 'K']},
'F': {'children': ['L', 'M']},
}
fig = go.Figure(data=[go.Treemap(root='A', hoverinfo="label+value")])
fig.update_layout(title="Tree Visualization", font=dict(size=12))
To visualize a tree structure with NetworkX, you can use its draw_networkx() function. This library supports various graph layouts, including radial, circular, and spring-embedded representations.
Example:
import networkx as nx
Create an empty graph
G = nx.Graph()
Add nodes to the graph (tree structure)
G.add_node('A')
G.add_node('B', parent='A')
G.add_node('C', parent='A')
G.add_node('D', parent='B')
G.add_node('E', parent='B')
G.add_node('F', parent='C')
G.add_node('G', parent='C')
Draw the graph
nx.draw_networkx(G, node_color='lightblue')
QGraphicsView widget for visualizing graphs and networks.
To create an interactive tree visualization with PyQtGraph, you can subclass its QGraphicsScene class and add custom nodes (e.g., QGraphicsEllipseItem) representing the tree structure. You then connect these nodes to each other using directed edges (QGraphicsPathItem).
Example:
import pyqtgraph as pg
class TreeVisualization(pg.QGraphicsView):
def init(self, *args, **kwargs):
super().init(*args, **kwargs)
Create a scene for the tree visualization
self.scene = pg.QGraphicsScene()
self.setScene(self.scene)
Add nodes to the scene (tree structure)
node_A = pg.QGraphicsEllipseItem(0, 0, 20, 20)
node_B = pg.QGraphicsEllipseItem(20, 20, 10, 10)
node_C = pg.QGraphicsEllipseItem(30, 30, 15, 15)
node_D = pg.QGraphicsEllipseItem(40, 40, 5, 5)
Connect nodes to each other
edge_AB = pg.QGraphicsPathItem()
edge_BC = pg.QGraphicsPathItem()
edge_CD = pg.QGraphicsPathItem()
self.scene.addItem(node_A)
self.scene.addItem(node_B)
self.scene.addItem(node_C)
self.scene.addItem(node_D)
Set up node positions and edge connections
node_A.setPos(100, 100)
node_B.setPos(120, 80)
node_C.setPos(140, 60)
node_D.setPos(160, 40)
edge_AB.addPath(pg.QPainterPath().addRect(100, 110, 20, 10))
edge_BC.addPath(pg.QPainterPath().addRect(120, 90, 15, 5))
edge_CD.addPath(pg.QPainterPath().addRect(140, 70, 10, 10))
self.scene.addItem(edge_AB)
self.scene.addItem(edge_BC)
self.scene.addItem(edge_CD)
These libraries provide a solid foundation for creating interactive tree visualizations in Python. Depending on your specific requirements and the complexity of your data, you may need to combine multiple libraries or implement custom solutions using other Python frameworks like Matplotlib or Seaborn.
Remember that tree visualization is an excellent way to illustrate complex hierarchical relationships, making it easier to comprehend and analyze your data.
Python binary tree visualization
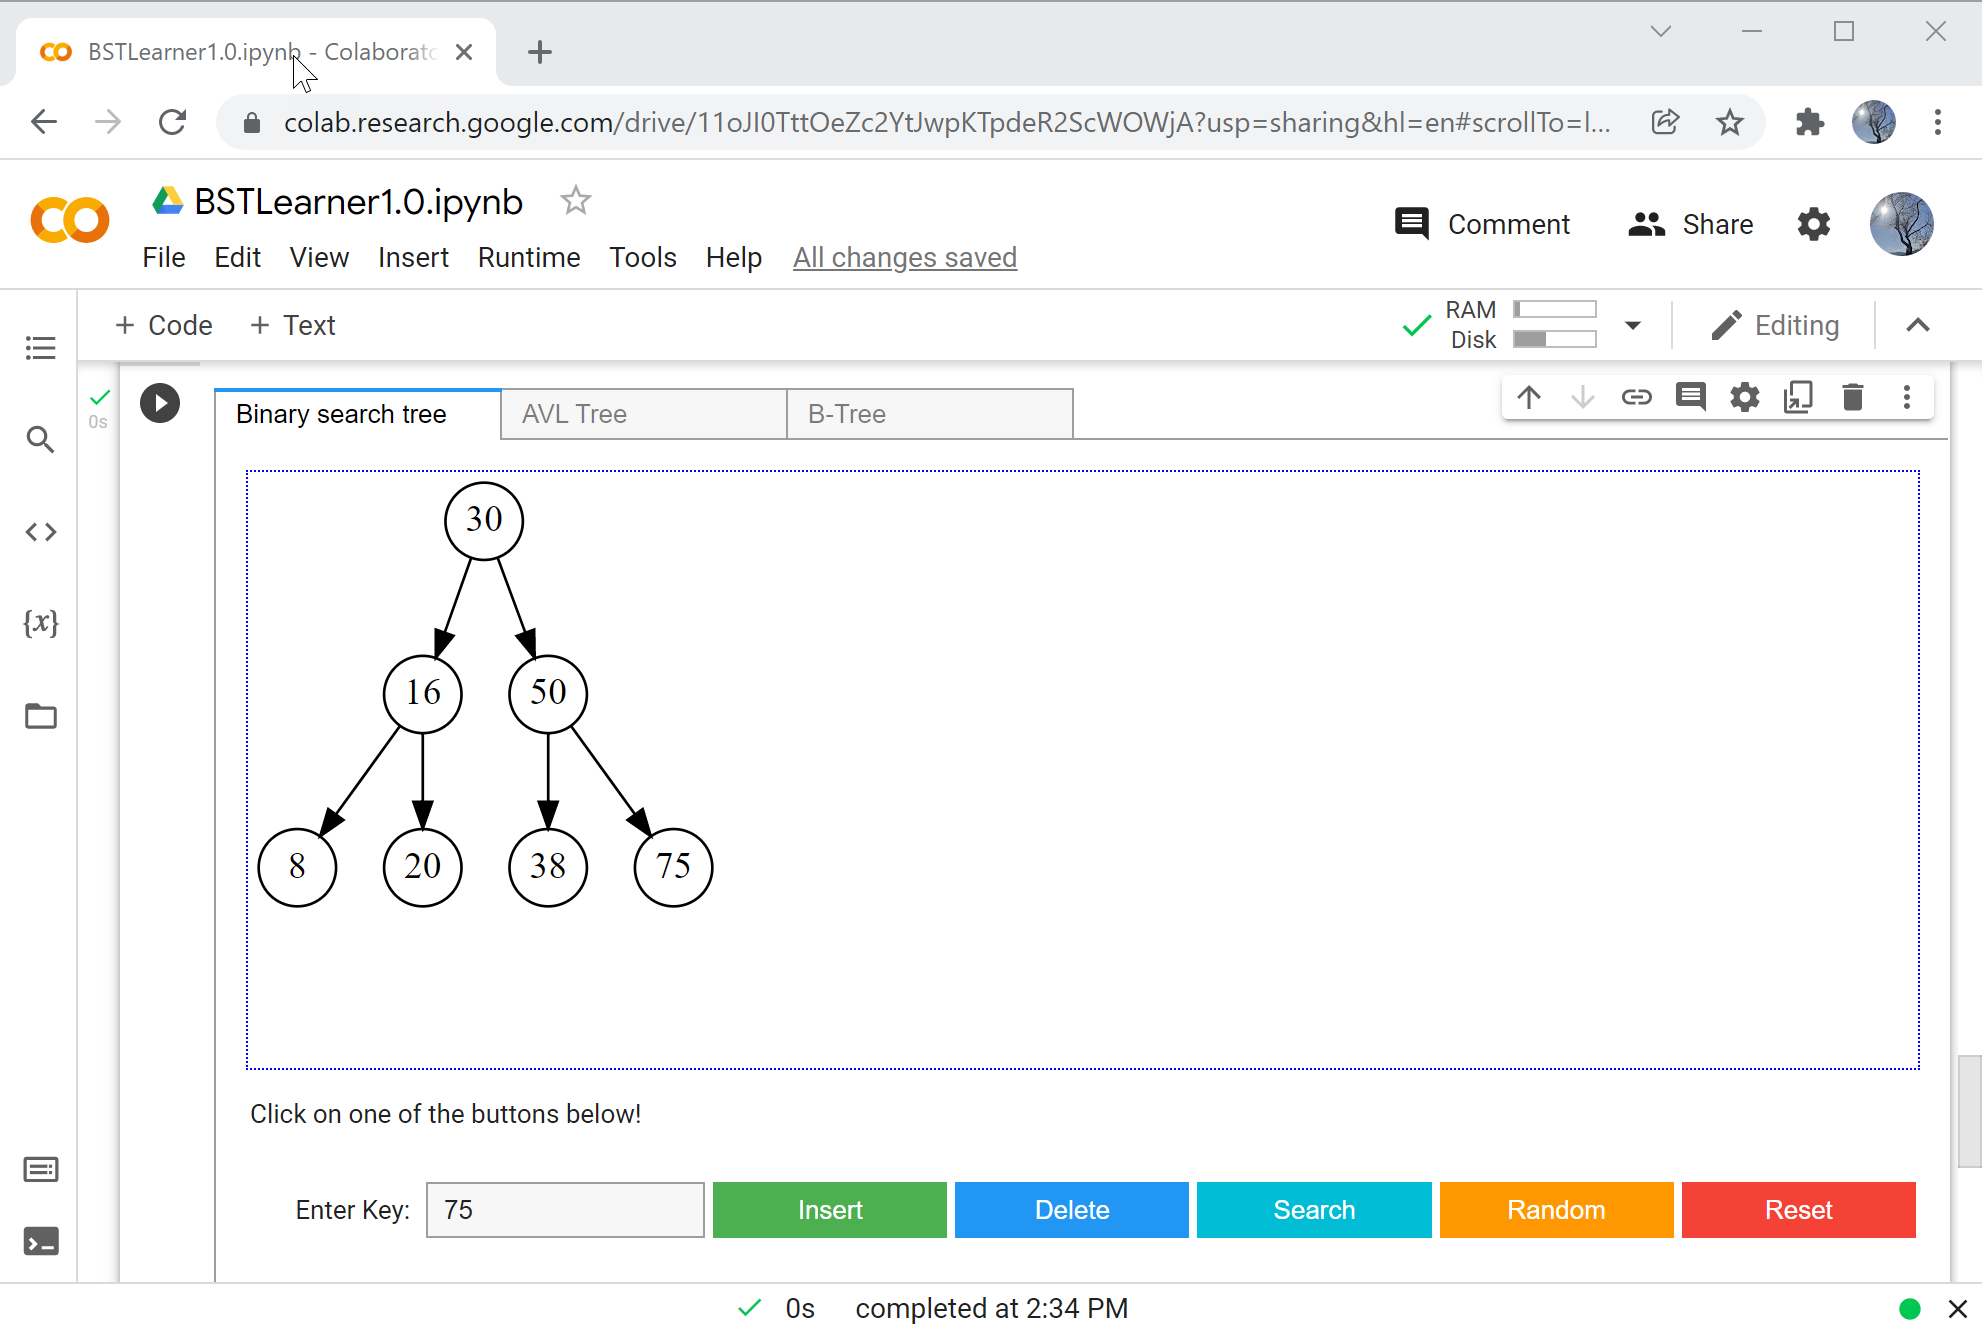
Python Binary Tree Visualization
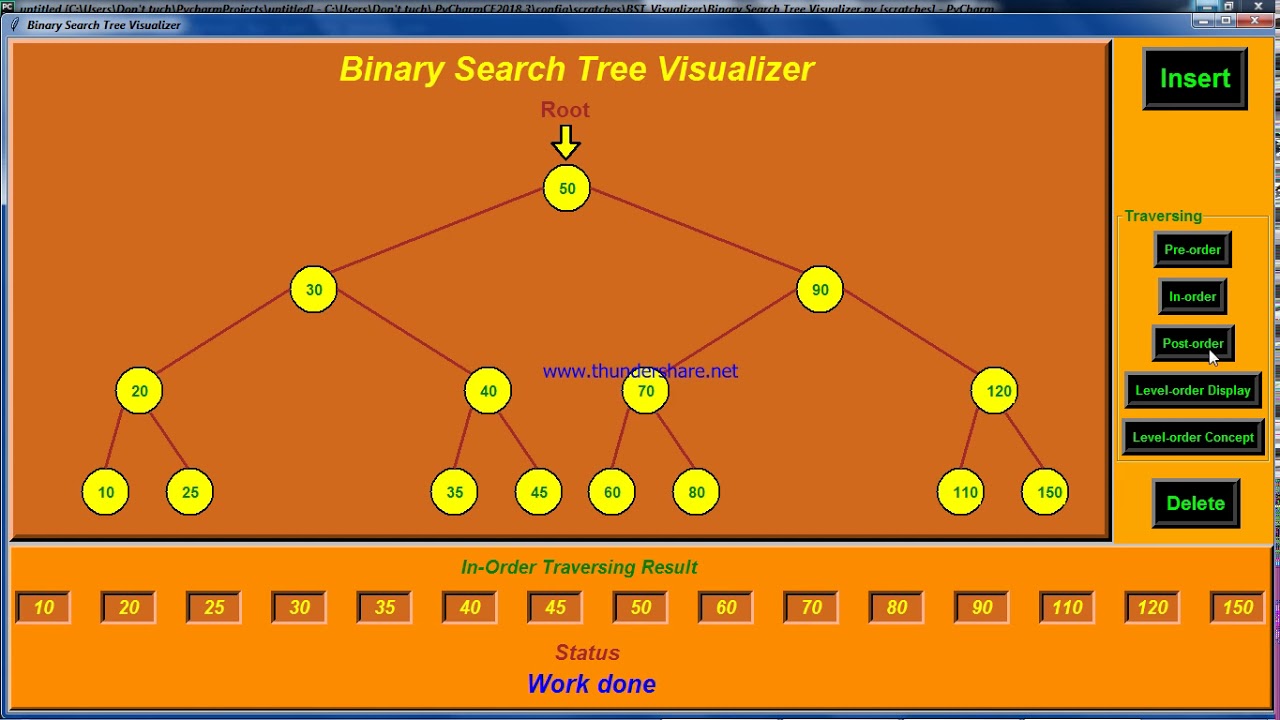
Visualizing a binary tree in Python can be an interesting and educational task. In this response, I'll walk you through a step-by-step guide on how to create a basic binary tree visualization using Python.
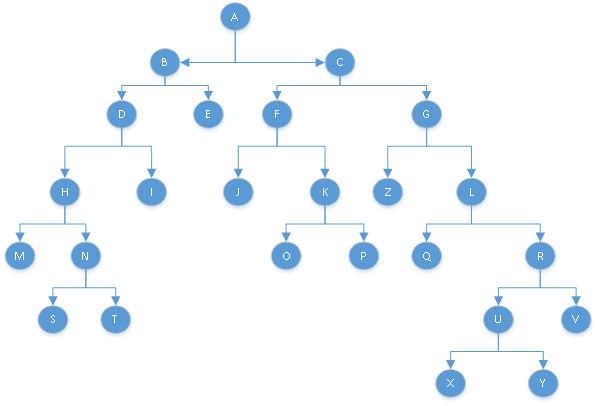
Before we dive into the code, let's quickly review what a binary tree is:
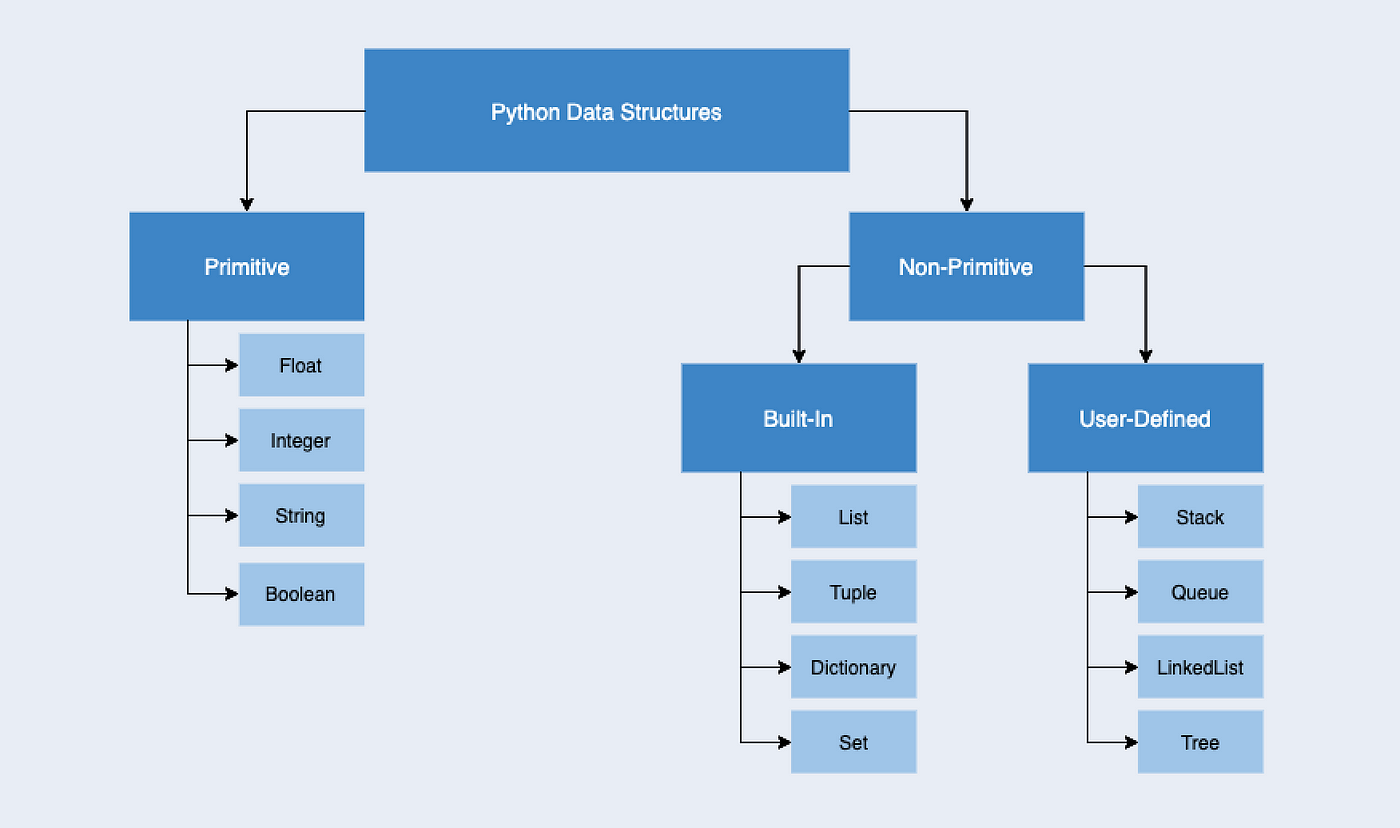
A binary tree is a data structure where each node has at most two children (i.e., left child and right child). This tree-like data structure is particularly useful for organizing data in a hierarchical manner. In this example, we'll be working with a simple binary tree where each node contains an integer value.
Step 1: Create the Binary Tree
First, let's define our binary tree using Python classes. We'll create a Node class to represent individual nodes in the tree and a BinaryTree class to manage the entire tree:
class Node:
def init(self, value):
self.value = value
self.left = None
self.right = None
class BinarySearchTree:
def init(self):
self.root = None
def insert(self, value):
if not self.root:
self.root = Node(value)
else:
self._insert_recursive(self.root, value)
def _insert_recursive(self, node, value):
if value < node.value:
if node.left is None:
node.left = Node(value)
else:
self._insert_recursive(node.left, value)
else:
if node.right is None:
node.right = Node(value)
else:
self._insert_recursive(node.right, value)
def visualize(self):
pass  # We'll get to this step later
Step 2: Visualize the Binary Tree
Now that we have our binary tree data structure set up, let's focus on creating a visualization function. We can use a recursive approach to traverse the tree and create a string representation of each node. This will give us a basic text-based visualization:
class BinarySearchTree:
... (previous code remains the same)
def visualize(self):
self._visualize_recursive(self.root, "")
def _visualize_recursive(self, node, indent):
if node is None:
return
string = f"{indent}{node.value}n"
if node.left is not None:
string += self._visualize_recursive(node.left, indent + "  ")
if node.right is not None:
string += self._visualize_recursive(node.right, indent + "  ")
print(string)
The visualize method calls the _visualize_recursive function, which recursively traverses the tree. The indent parameter helps to create a hierarchical representation of the nodes. For each node, we append its value followed by a newline character (n). We also handle indentation for child nodes.
Step 3: Create a Basic Visualization
Now that we have our visualization function in place, let's test it with some sample data:
# Create a binary tree and insert values
tree = BinarySearchTree()
values = [5, 2, 8, 3, 9, 1, 7]
for value in values:
tree.insert(value)
Visualize the binary tree
tree.visualize()
This code snippet creates a BinarySearchTree object, inserts the specified values, and then visualizes the resulting binary tree. The output will be a text-based representation of the nodes and their relationships.
Conclusion
In this response, we've created a basic binary tree visualization using Python classes. We started with defining our data structure, inserted values into the tree, and finally, implemented a simple text-based visualization function to display the tree's contents. This is just the beginning; you can enhance your visualization by using GUI libraries (e.g., Tkinter or PyQt) or exploring more advanced techniques like graph theory.
Happy coding!
