Prometheus client Python gauge example
Prometheus client Python gauge example
Here is an example of using the Prometheus client with Python to create a gauge:
First, you need to install the Prometheus client library for Python. You can do this by running the following command:
pip install prometheus-client
Once installed, here's an example code snippet that creates a gauge and pushes it to Prometheus:
import prometheus_client as pc
Create a Prometheus gauge
class MyGauge(pc.Gauge):
def init(self, name, docstring=""):
super().init(name, docstring)
def update(self, value):
self.set(value)
if name == "main":
Start the Prometheus client
pc.start_http_server(8000)
Create a gauge and set it to 42
my_gauge = MyGauge("my_gauge", "My gauge example")
my_gauge.update(42)
try:
while True:
Simulate some work being done
import time
time.sleep(1)
my_gauge.update(int(time.time()))
except KeyboardInterrupt:
pass
This will push the gauge value to Prometheus every 1 second
This code creates a gauge called my_gauge and updates it every second with the current Unix timestamp.
Now, let's talk about how this works:
pc.Gauge: This is a class from the Prometheus client library that represents a gauge. A gauge is a metric type that measures a value over time. MyGauge: This is a custom class that inherits from pc.Gauge. It adds an update method to set the value of the gauge. super().__init__(name, docstring): This line calls the constructor of the superclass (pc.Gauge) with the given name and docstring. This initializes the gauge and gives it a name and documentation that can be displayed in Prometheus. my_gauge.update(value): This method sets the value of the gauge to the given value. try/except block: This is where the magic happens. The code simulates some work being done (in this case, sleeping for 1 second), and then updates the gauge with the current Unix timestamp.
Now, let's talk about how you can use Prometheus to view your gauge:
You can start the Prometheus server by running python prometheus_server.py (or whatever name you choose for your Python file). This will start the Prometheus server on port 8000 by default.
Open a web browser and go to http://localhost:8000. This is where you'll see all the metrics that are being scraped. You can view your gauge and its value over time by clicking on the "my_gauge" link.
To get more advanced, you can also use Grafana (https://grafana.com/), which is a popular tool for visualizing Prometheus data.
In this example, we're using Python to push a gauge to Prometheus, but you can do the same thing in other languages like Java or Go. The Prometheus client libraries for these languages are similar to the one for Python.
Python Prometheus query example

I'm happy to help!
Python Prometheus Query Example
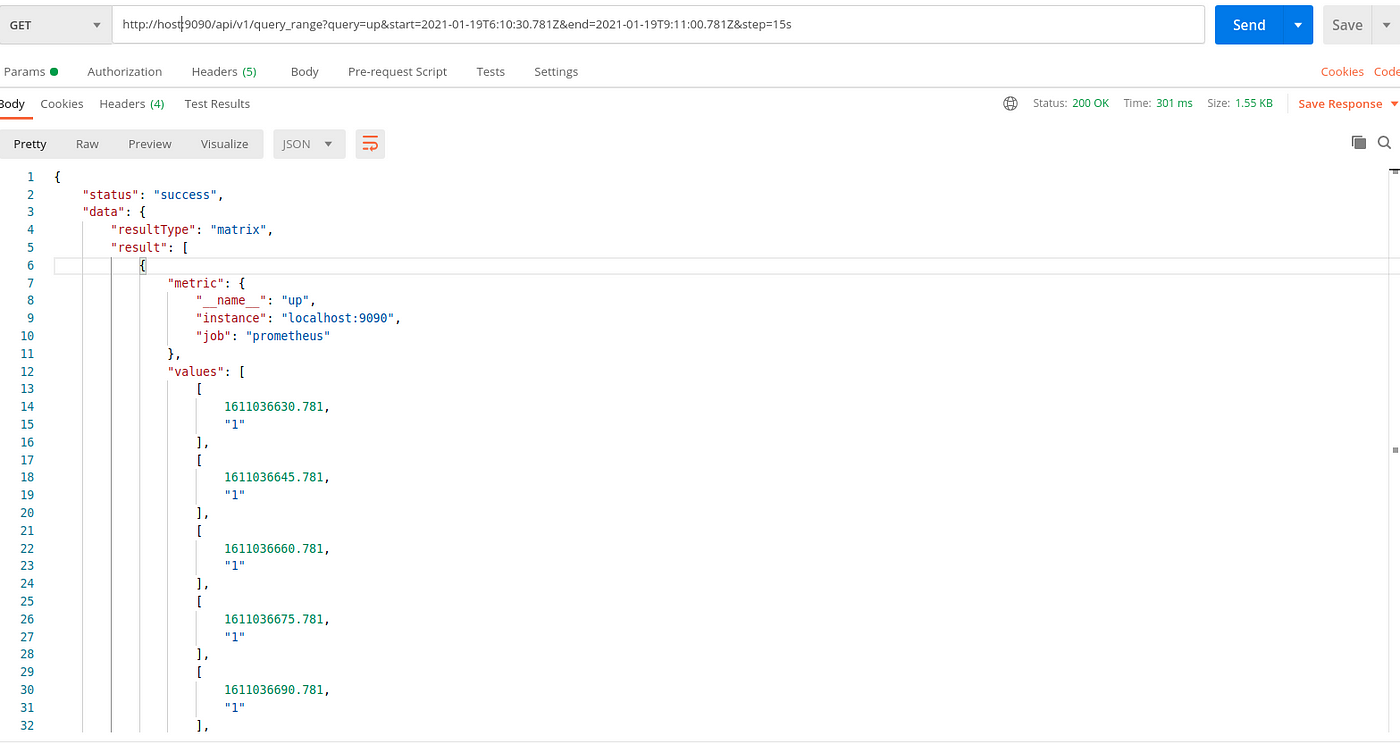
Prometheus is a popular open-source monitoring system that provides a powerful query language for retrieving and analyzing metrics. In this example, we'll explore how to use Python to interact with Prometheus and execute queries.
Prerequisites
Install theprometheus-client library by running pip install prometheus-client Make sure you have a Prometheus server up and running Familiarize yourself with Prometheus query language (see Prometheus Query Language)
Python Code Example
import requests
from prometheus_client import promote, make_wsgi_app
Set the URL of your Prometheus instance
PROMETHEUS_URL = "http://localhost:9090"
def query_prometheus(query):
Set the headers and payload for the request
headers = {"Content-Type": "text/plain"}
data = {"query": query, "timeout_ms": 1000}
Send the POST request to Prometheus
response = requests.post(PROMETHEUS_URL + "/api/v1/query", headers=headers, json=data)
Check if the request was successful
if response.status_code == 200:
return response.json()
else:
raise Exception(f"Error querying Prometheus: {response.text}")
Define a query to retrieve CPU usage for each node in your cluster
query = "avg(node_cpu_usage) by (node)"
Execute the query and parse the result
result = query_prometheus(query)
Print the result
print(result)
This code snippet demonstrates how to use Python to execute a Prometheus query. It sets up a request to send a POST query to the Prometheus instance at the specified URL, with the query string encoded in the payload. The response from Prometheus is then parsed and returned as JSON.
Query Examples
Here are some examples of queries you can run using this code:
CPU usage:avg(node_cpu_usage) by (node) - Get the average CPU usage for each node in your cluster. Memory usage: sum(container_memory_usage_bytes) by (container) - Summarize memory usage by container across all nodes. Network traffic: sum(http_request_duration_seconds_sum) by (http_host, http_method) - Summarize the total request duration for each host and method.
Tips and Variations
Error handling: You can add try-except blocks to catch any exceptions that might occur during the query execution. Query parameters: You can modify thequery variable to include custom parameters, such as filtering by time range or metric names. Results parsing: You can parse the result JSON to extract specific data points or perform further analysis.
This example provides a basic foundation for working with Prometheus using Python. You can extend and customize this code to fit your specific monitoring needs!
