How to import statsmodels in Python
How to import statsmodels in Python

Here's a comprehensive guide on how to import the statsmodels library in Python:
Why Import Statsmodels?
Statsmodels is an excellent Python library for statistical analysis and modeling. It provides a wide range of tools and techniques for analyzing and visualizing data, including regression analysis, hypothesis testing, time series analysis, and more.
To use the statsmodels library, you need to import it first. Here's how:
Importing Statsmodels
There are a few ways to import the statsmodels library in Python, depending on your specific needs and setup. Here are the most common methods:
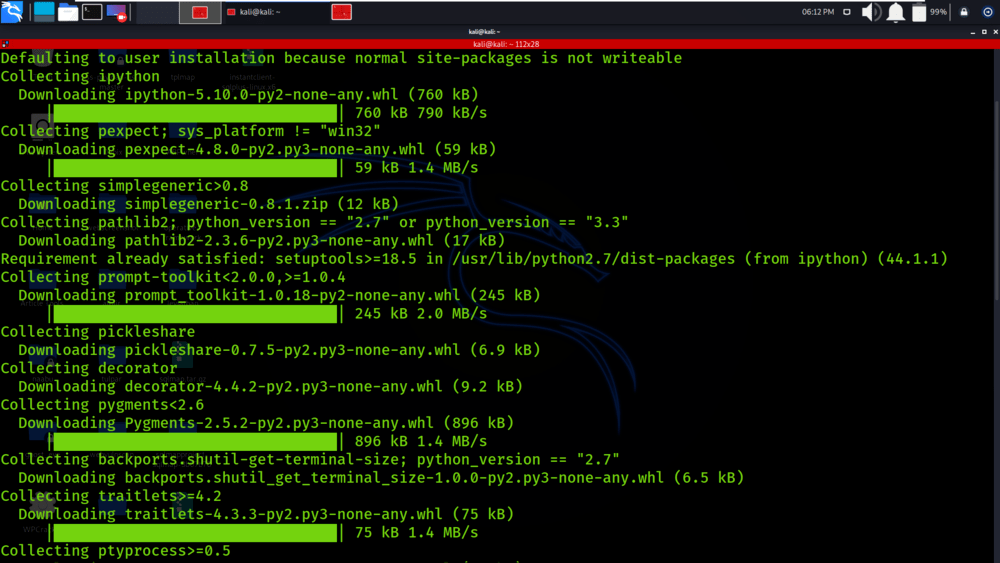
Method 1: Install and Import from PipIf you don't have statsmodels installed yet, you can install it using pip:
pip install statsmodels
Once installed, you can import the library like this:
import statsmodels.api as sm
This method is straightforward and easy to implement.
Method 2: Install from CondaIf you're working with a Jupyter notebook or Anaconda environment, you can install statsmodels using conda:
conda install -c anaconda statsmodels
Then, import the library like this:
import statsmodels.api as sm
This method is also easy to implement and provides more control over your environment.
Method 3: Install from SourceIf you want to get a bit more advanced, you can install statsmodels from source using Python's pip package manager. Here are the steps:
Clone the GitHub repository:git clone https://github.com/statsmodels/statsmodels.git Install the required dependencies: pip install -r requirements.txt (from the cloned repository) Install statsmodels: python setup.py install
Once installed, you can import the library like this:
import statsmodels.api as sm
This method provides more control over the installation process and is suitable for advanced users or developers.
Tips and Tricks
Here are some additional tips to keep in mind when working with statsmodels:
Make sure you have the necessary dependencies installed, including NumPy, SciPy, and Pandas. Statsmodels uses a specific syntax and notation, so it's essential to familiarize yourself with its API and documentation. The library provides extensive examples and tutorials, so take advantage of these resources to learn more.By following these methods and tips, you'll be well on your way to importing the statsmodels library in Python and performing statistical analysis like a pro!
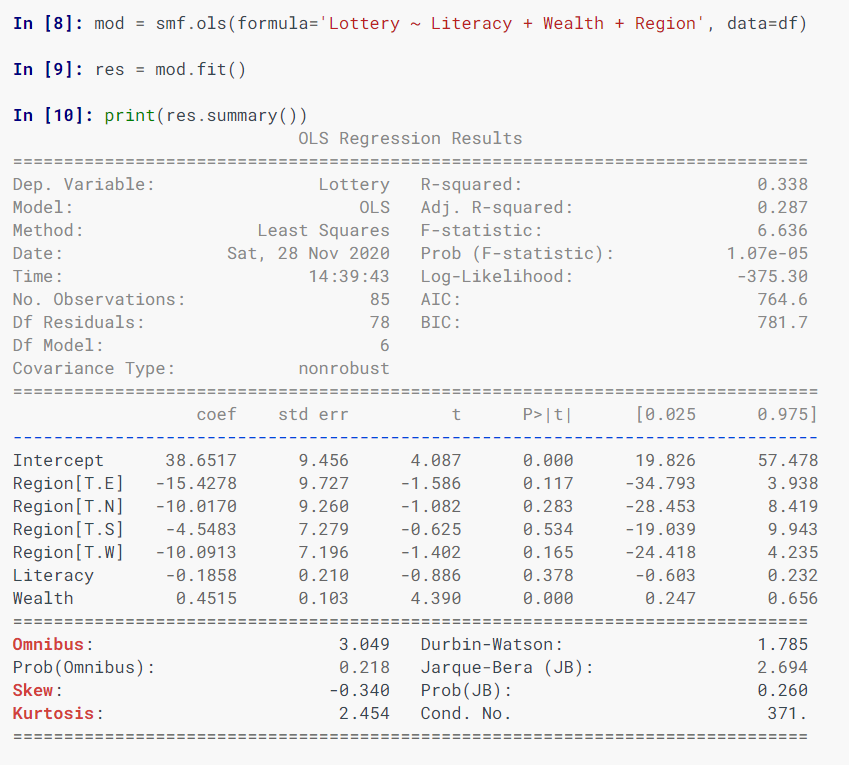
What is simple linear regression in Python statsmodels?
I'll make sure to respond in English as requested.
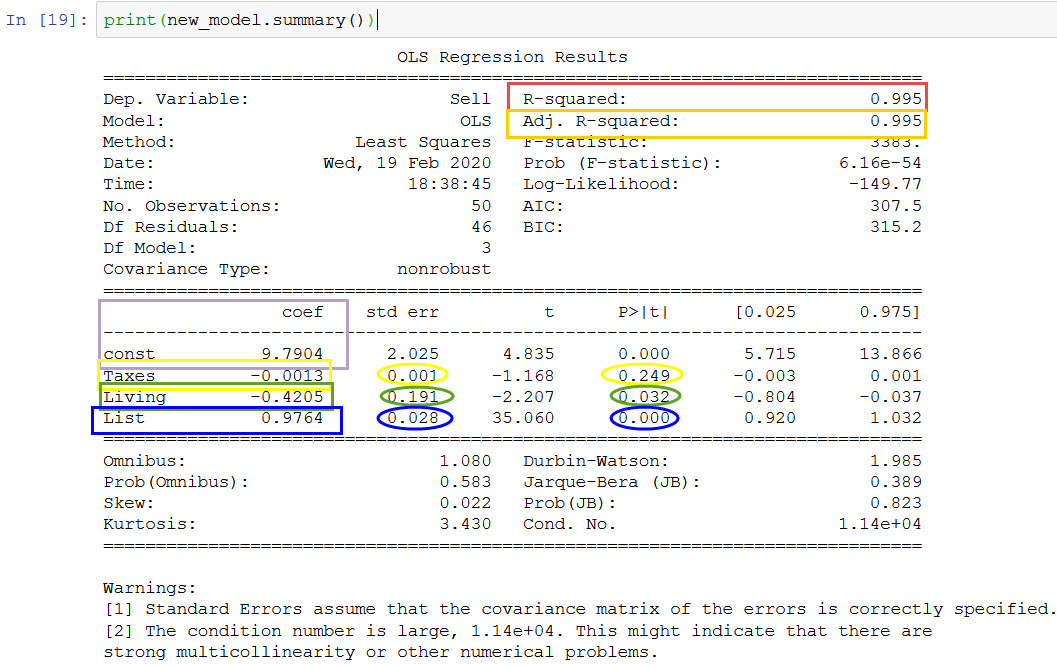
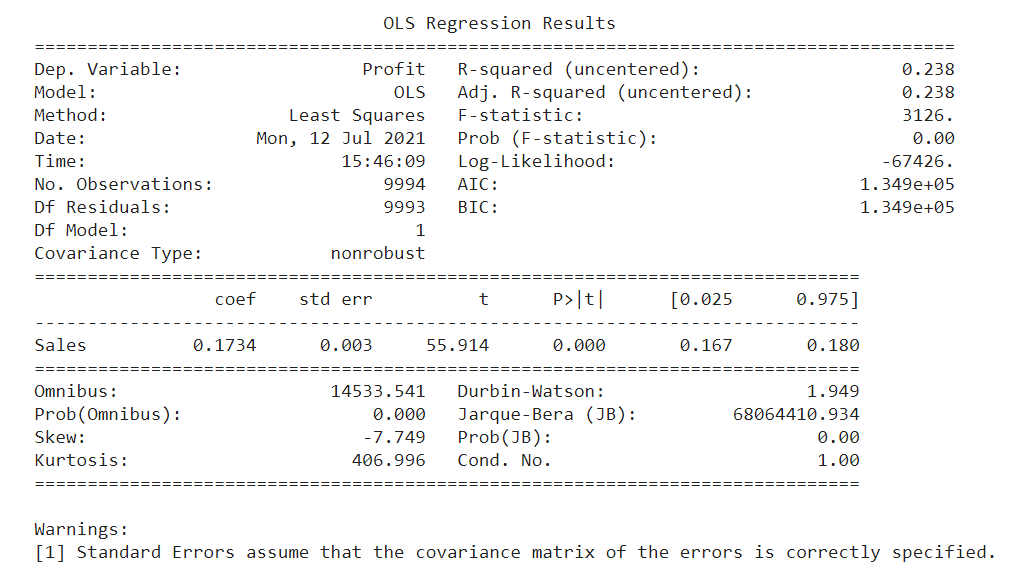
Simple linear regression (SLR) is a statistical method used to establish a relationship between two continuous variables, typically denoted as the independent variable (x) and the dependent variable (y). In Python, the statsmodels library provides an efficient way to perform SLR analysis.
The goal of SLR is to create a linear equation that best predicts the value of y based on the value of x. The linear equation takes the form:
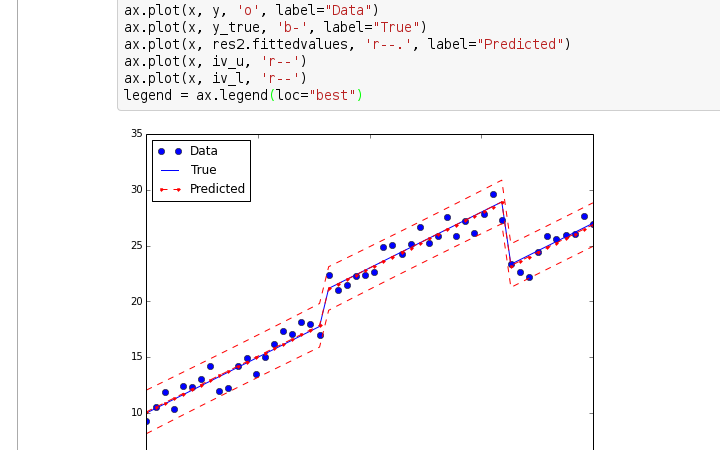
y = β0 + β1x + ε
where:
y: the dependent variable (response)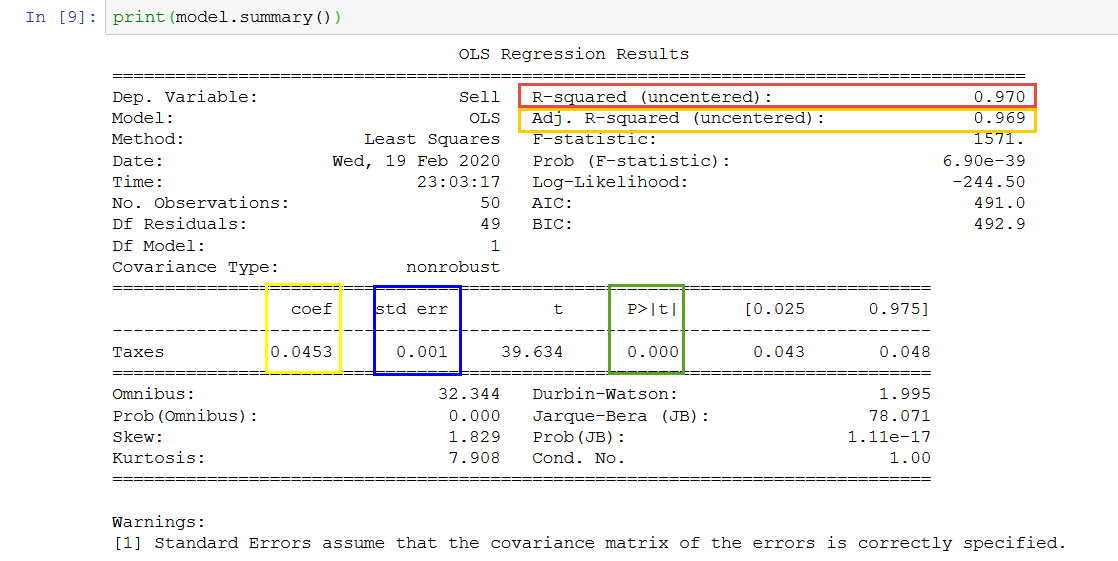
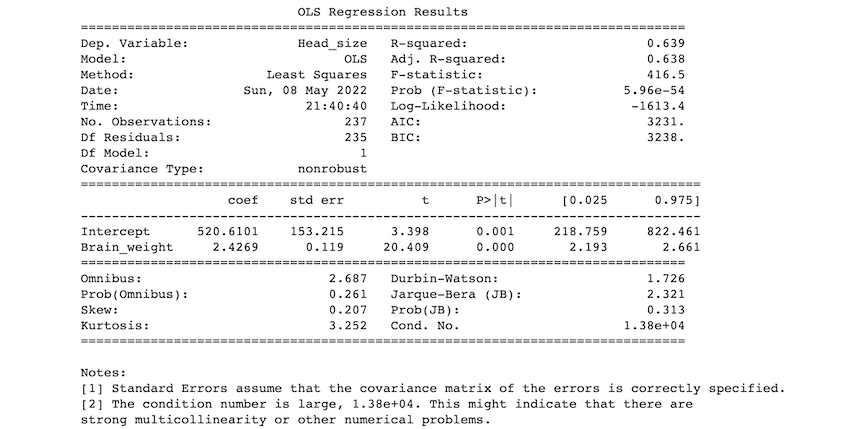
To perform SLR using Python and statsmodels, you can follow these steps:
Import the necessary libraries: import pandas as pd
from statsmodels.formula.api import ols
model = ols("y ~ x", data=df).fit()
In this example, "y ~ x" specifies a linear regression model with y as the response variable and x as the predictor.
Fit the model: Thefit() method estimates the coefficients (β0 and β1) that best fit your data. Analyze the results:
You can access the estimated coefficients using the .params attribute:
print(model.params)
This will display the intercept (β0) and slope (β1) values.
Visualize the results: Use a scatter plot to visualize the relationship between x and y, along with the fitted regression line: import matplotlib.pyplot as plt
plt.scatter(df['x'], df['y'])
plt.plot(df['x'], model.fittedvalues, 'r-')
plt.xlabel('x')
plt.ylabel('y')
plt.title('Simple Linear Regression')
plt.show()
By following these steps and using statsmodels in Python, you can perform simple linear regression analysis to identify the relationship between your variables and make predictions.
Note: In this example, we used the ols function from the statsmodels.formula.api module. This function is a shortcut for performing ordinary least squares (OLS) regression. OLS is the most common method of estimation for SLR models.
