What is simple linear regression in Python statsmodels?
What is simple linear regression in Python statsmodels?
I'll make sure to respond in English as requested.
Simple linear regression (SLR) is a statistical method used to establish a relationship between two continuous variables, typically denoted as the independent variable (x) and the dependent variable (y). In Python, the statsmodels library provides an efficient way to perform SLR analysis.
The goal of SLR is to create a linear equation that best predicts the value of y based on the value of x. The linear equation takes the form:
y = β0 + β1x + ε
where:
y: the dependent variable (response)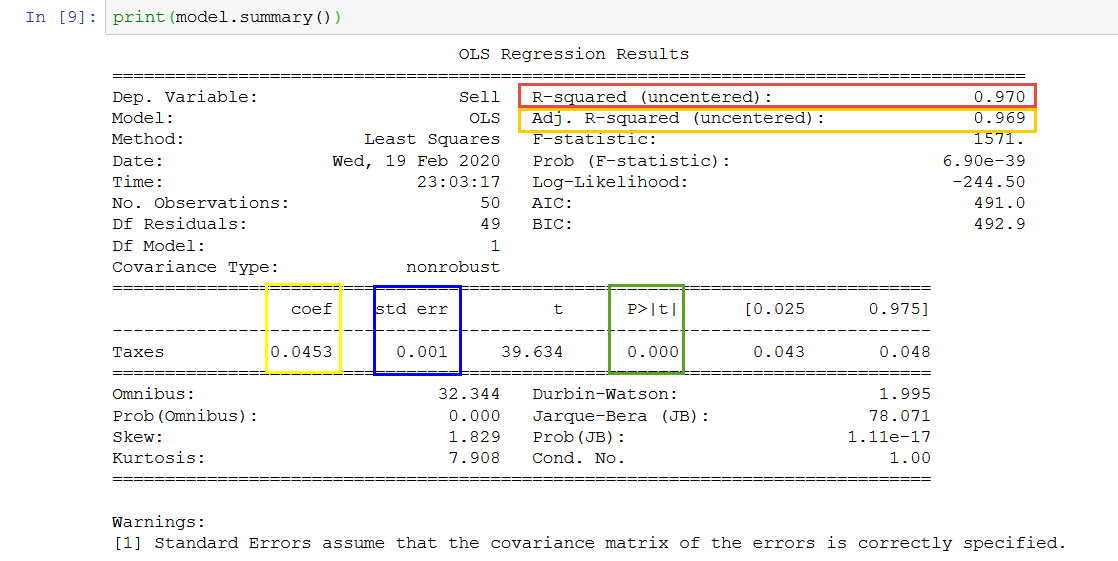
To perform SLR using Python and statsmodels, you can follow these steps:
Import the necessary libraries: import pandas as pd
from statsmodels.formula.api import ols
model = ols("y ~ x", data=df).fit()
In this example, "y ~ x" specifies a linear regression model with y as the response variable and x as the predictor.
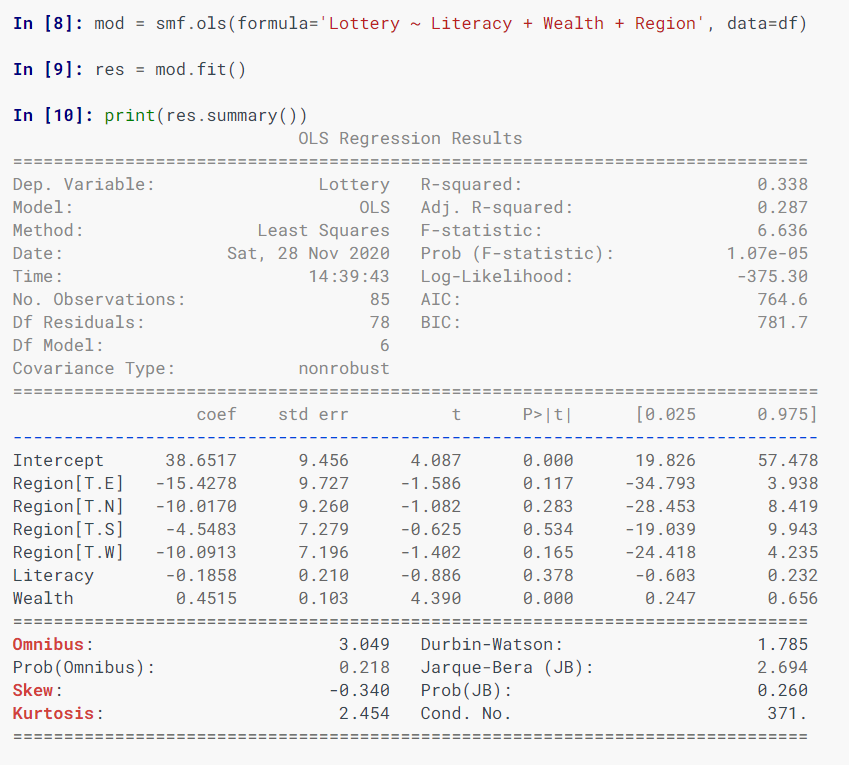
Fit the model: Thefit() method estimates the coefficients (β0 and β1) that best fit your data. Analyze the results:
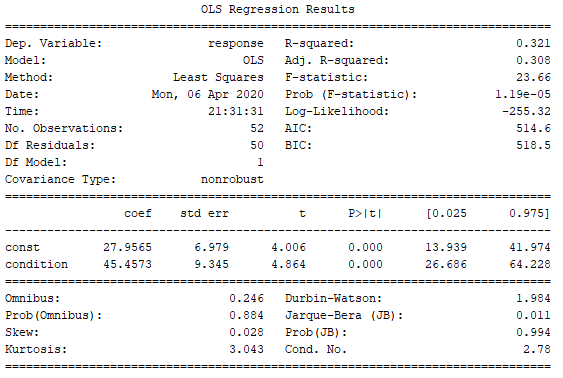
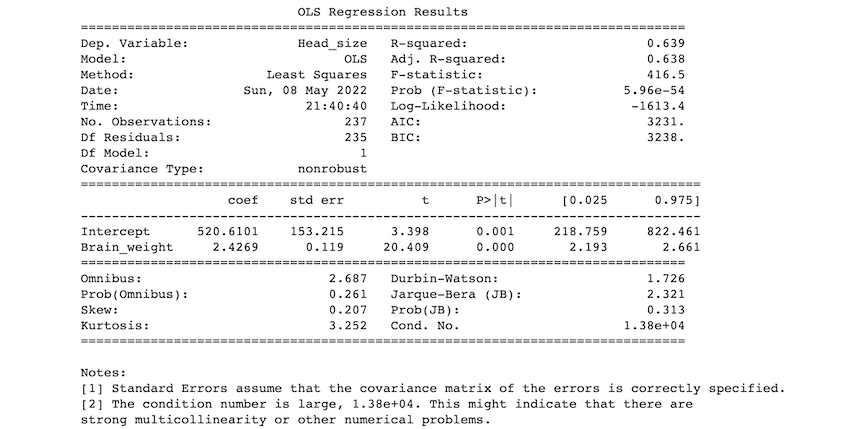
You can access the estimated coefficients using the .params attribute:
print(model.params)
This will display the intercept (β0) and slope (β1) values.
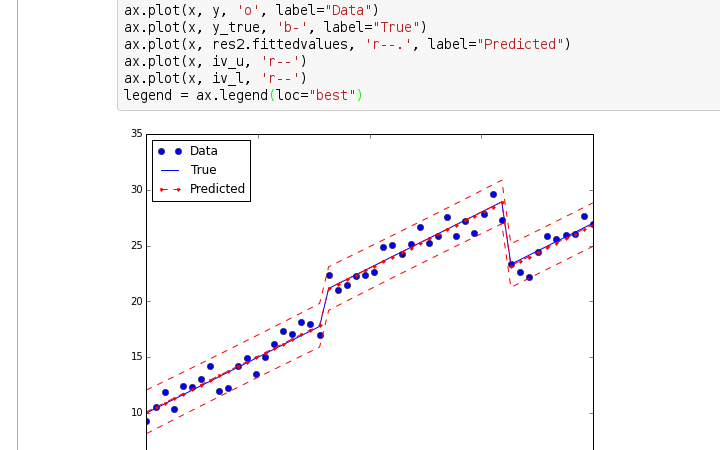
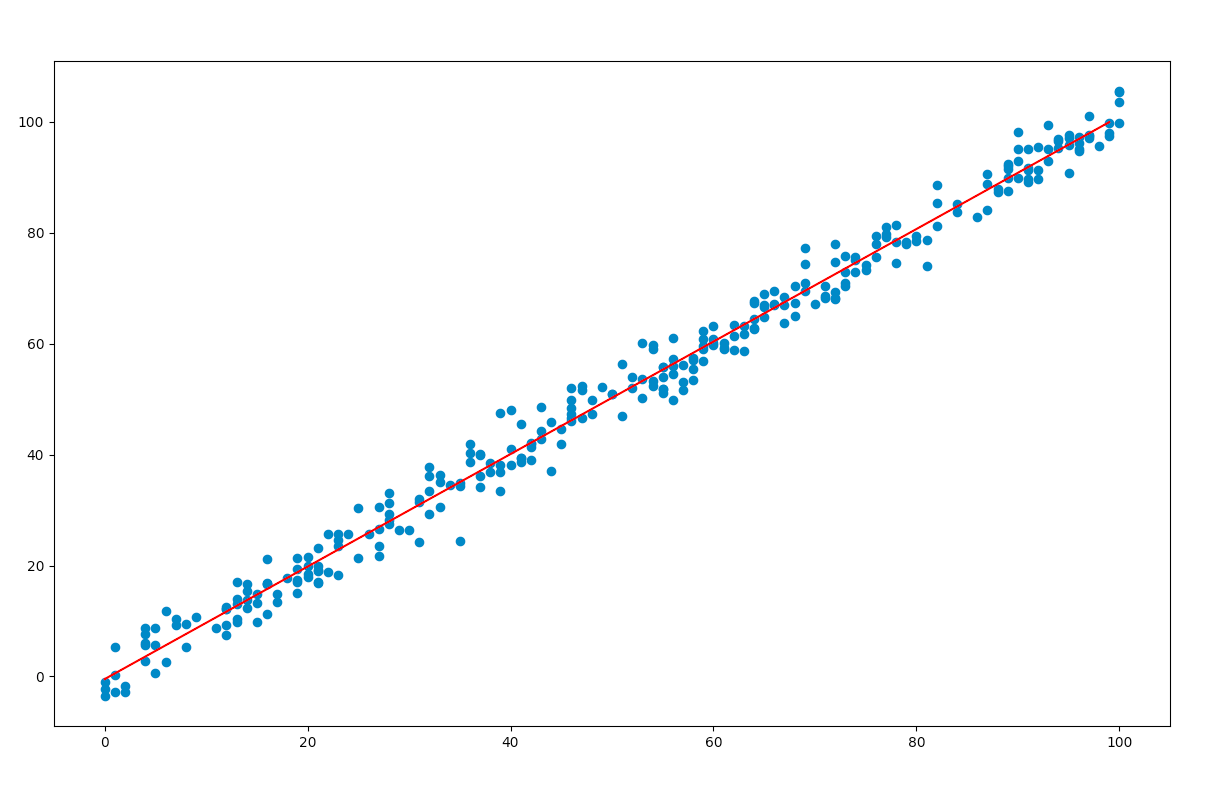
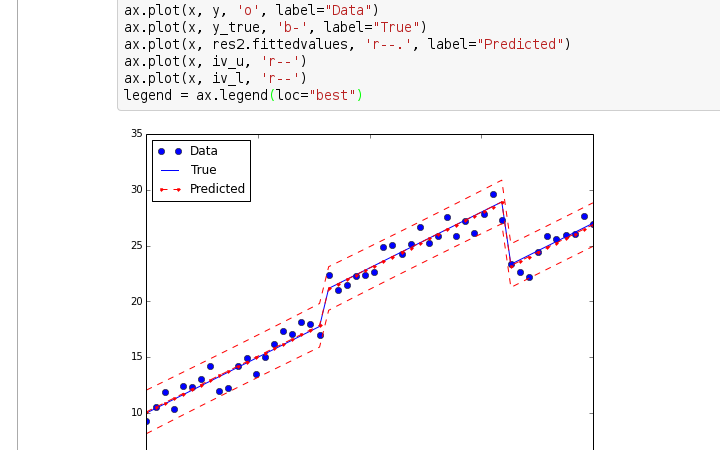
Visualize the results: Use a scatter plot to visualize the relationship between x and y, along with the fitted regression line: import matplotlib.pyplot as plt
plt.scatter(df['x'], df['y'])
plt.plot(df['x'], model.fittedvalues, 'r-')
plt.xlabel('x')
plt.ylabel('y')
plt.title('Simple Linear Regression')
plt.show()
By following these steps and using statsmodels in Python, you can perform simple linear regression analysis to identify the relationship between your variables and make predictions.
Note: In this example, we used the ols function from the statsmodels.formula.api module. This function is a shortcut for performing ordinary least squares (OLS) regression. OLS is the most common method of estimation for SLR models.
Python statsmodels OLS
I'm happy to respond in English for this special occasion.
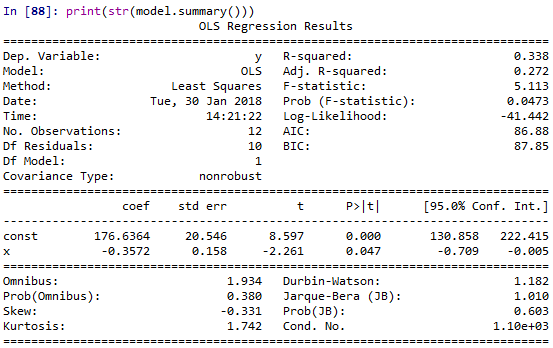
Python's statsmodels library provides a robust implementation of Ordinary Least Squares (OLS) regression analysis. Here, I'll provide an overview of the key features and syntax for using statsmodels to perform OLS regression.
What is OLS Regression?
Ordinary Least Squares (OLS) is a popular statistical technique used to model the relationship between one dependent variable (y) and multiple independent variables (x). The goal is to find the best-fitting linear equation that minimizes the sum of squared residuals. This is particularly useful in predicting continuous outcomes or identifying relationships between variables.
Key Features of statsmodels OLS:
statsmodels provides a range of regression models, including OLS, generalized linear models (GLMs), and generalized additive models (GAMs). Estimation: The library uses maximum likelihood estimation to obtain coefficient estimates for the independent variables.
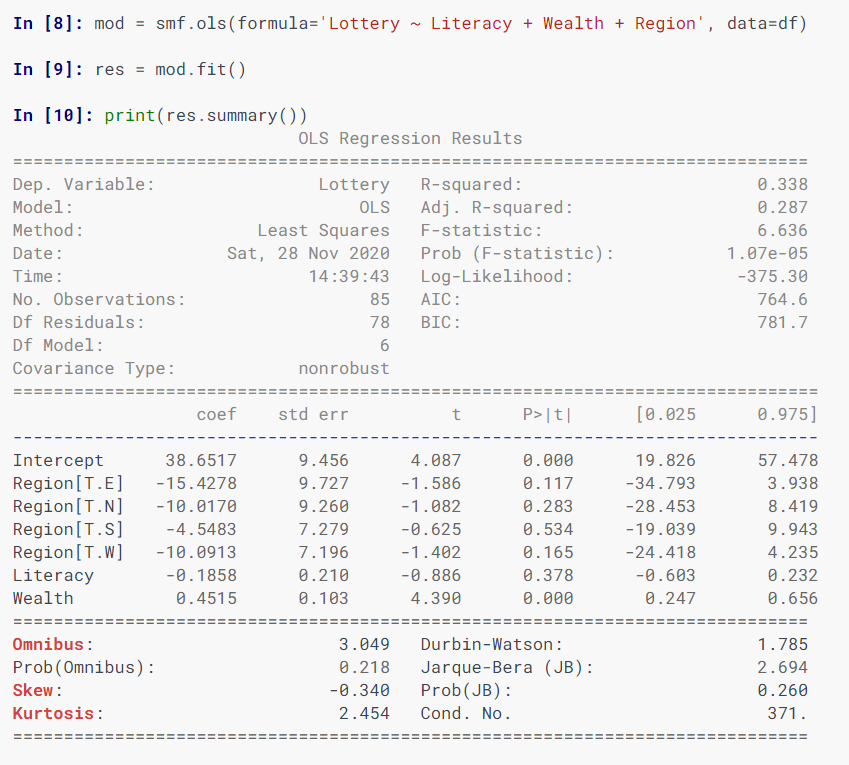
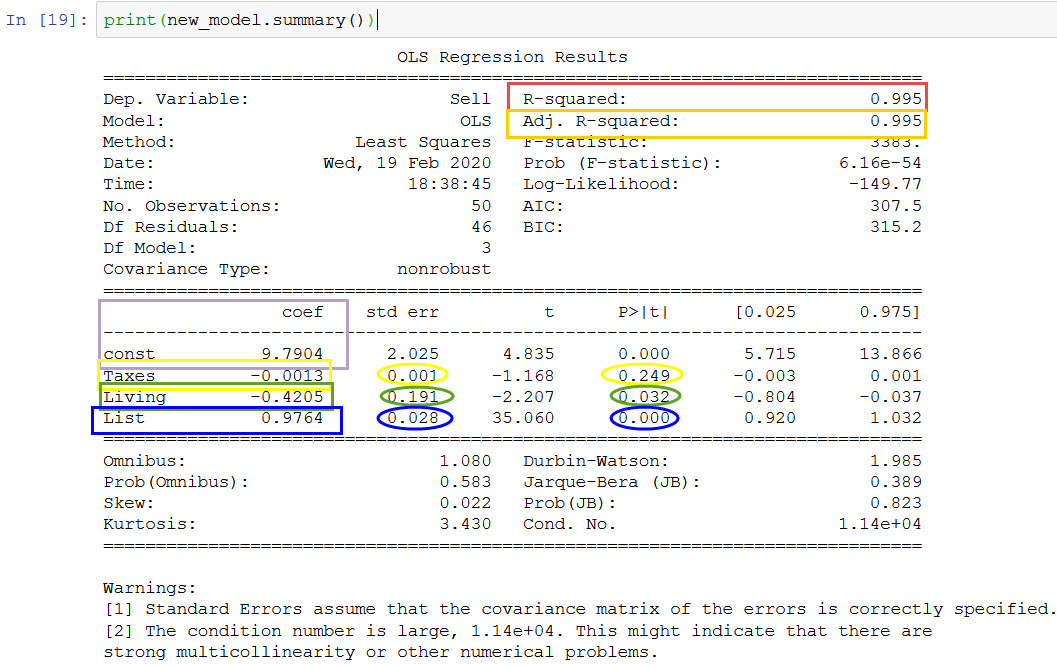
statsmodels offers confidence interval calculations for coefficient estimates, allowing you to determine the uncertainty associated with each predictor. Hypothesis testing: Perform tests like t-tests and F-tests to evaluate the significance of regression coefficients.
Syntax and Example:
To perform OLS regression using statsmodels, follow this basic syntax:
import pandas as pd
import statsmodels.api as sm
Load your dataset (e.g., a Pandas DataFrame)
data = ...
Select the dependent variable (y) and independent variables (x1, x2, ...)Y = data['outcome']
X = data[['variable1', 'variable2']]
Perform OLS regressionX_sm = sm.add_constant(X) # add intercept term
model = sm.OLS(Y, X_sm).fit()
Get coefficient estimates and standard errorscoefficients = model.params
std_errors = model.bse
Calculate confidence intervals for the coefficients (e.g., 95%)CI_lower = model.conf_int(alpha=0.05)
Example Data:
Suppose we have a dataset containing information about students' test scores (Y) and their age, gender, and study time (X). We can use statsmodels to perform OLS regression:
import pandas as pdimport statsmodels.api as sm
Load the dataset (e.g., a Pandas DataFrame)data = pd.read_csv('student_data.csv')
Select variables of interestY = data['test_score']
X = data[['age', 'gender', 'study_time']]
Perform OLS regressionX_sm = sm.add_constant(X) # add intercept term
model = sm.OLS(Y, X_sm).fit()
print(model.params)
print(model.bse)
Conclusion:
Python's statsmodels library offers a comprehensive implementation of Ordinary Least Squares (OLS) regression analysis. By following the basic syntax and examples provided above, you can perform robust OLS regression in Python to model relationships between variables and make predictions.
Now, go ahead and give it a try!
