python plotly dash
python plotly dash
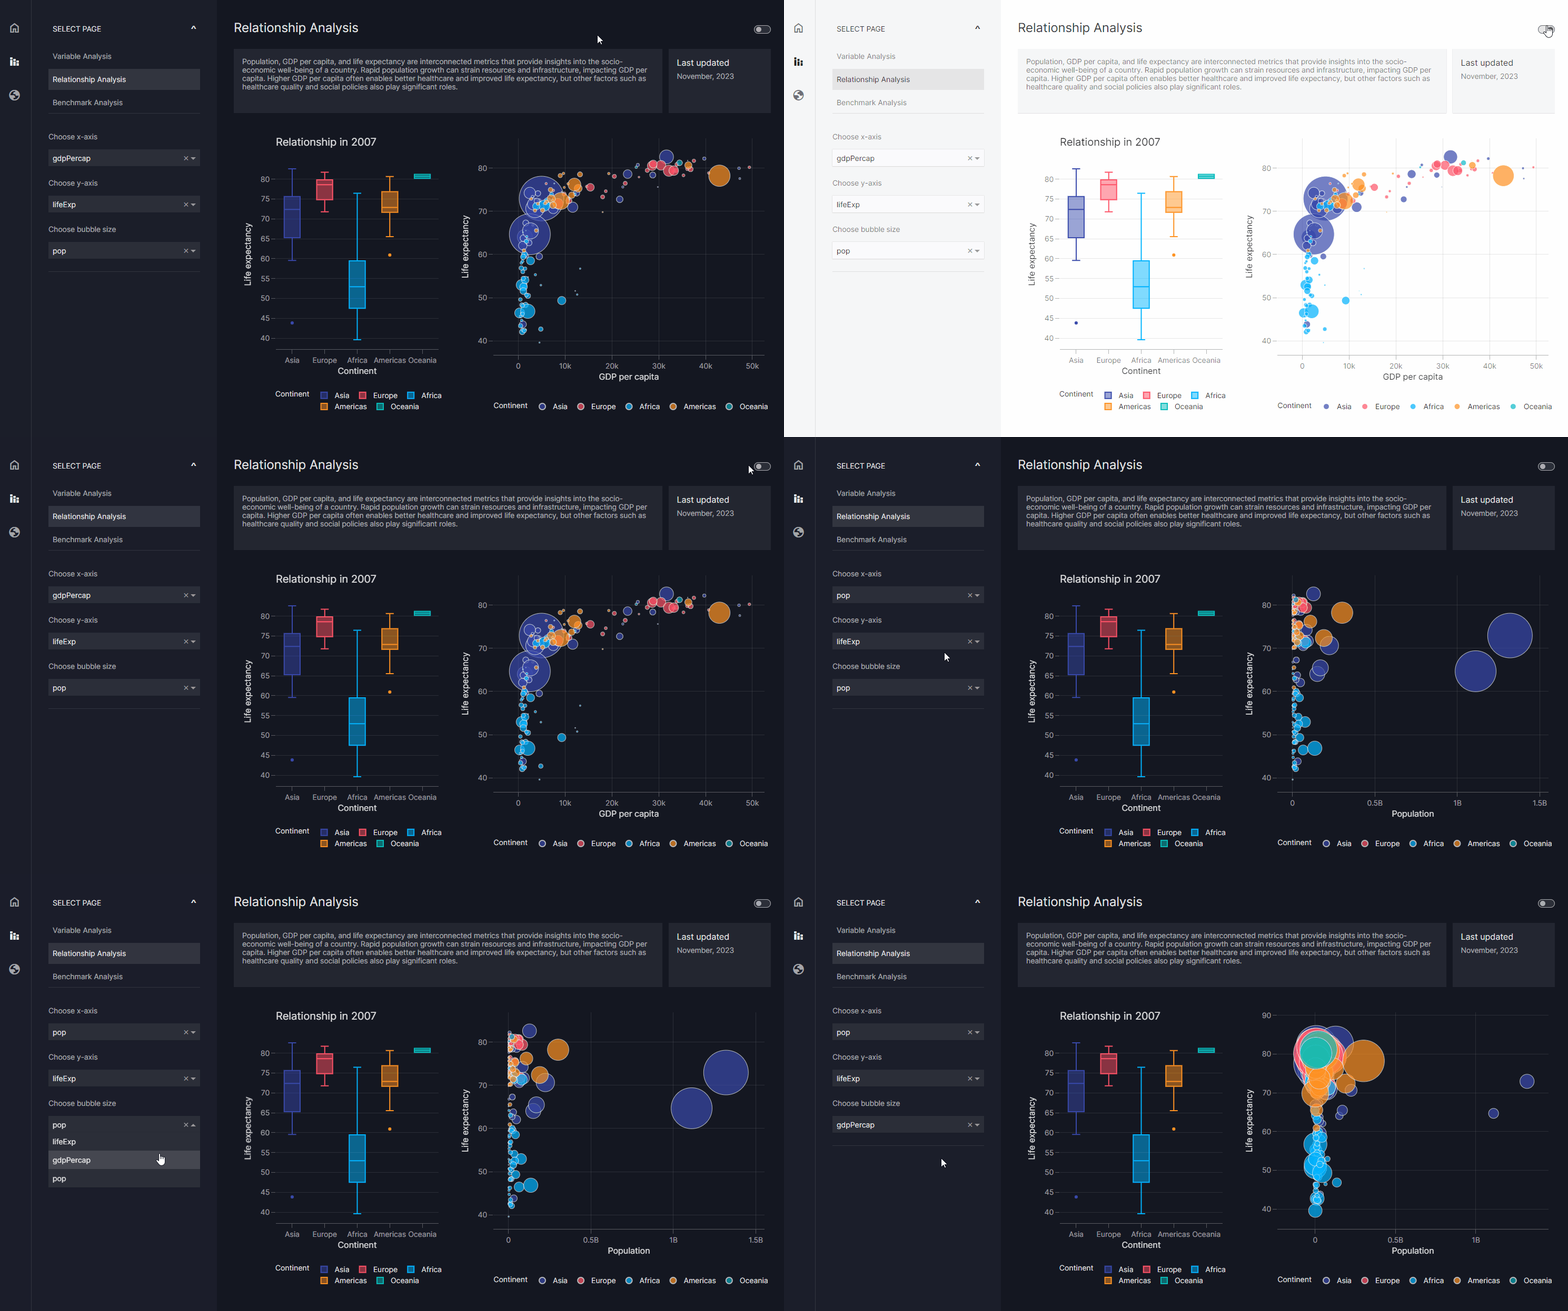
Here is a comprehensive guide on using Python's Plotly and Dash libraries to create interactive visualizations:
What are Plotly and Dash?
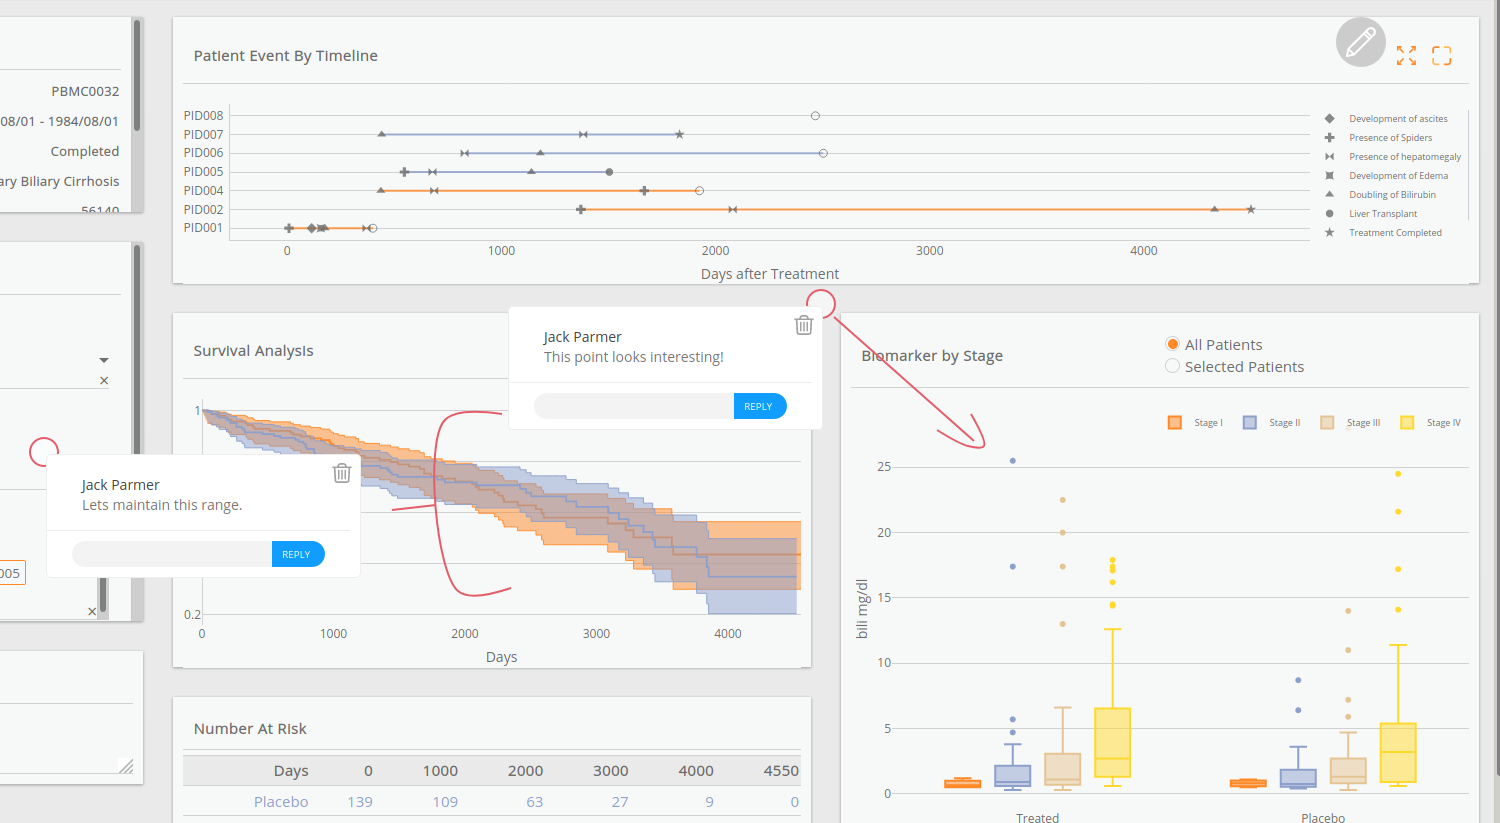
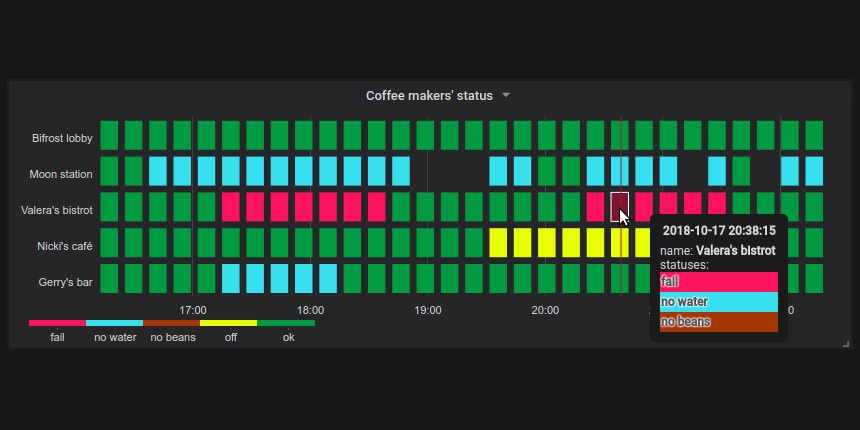
Plotly is an open-source library for creating interactive, web-based data visualizations. It allows you to create beautiful, animated, and interactive plots from your data. Plotly is particularly useful for exploratory data analysis, as it enables users to hover over data points, zoom in/out, and even animate the plot.
Dash, on the other hand, is a Python framework used for building web-based applications with reusable UI components. It's designed to be easy to learn and use, making it an excellent choice for beginners and experts alike. Dash can be used to create interactive visualizations, dashboards, and even fully-fledged web applications.
Why Use Plotly and Dash Together?
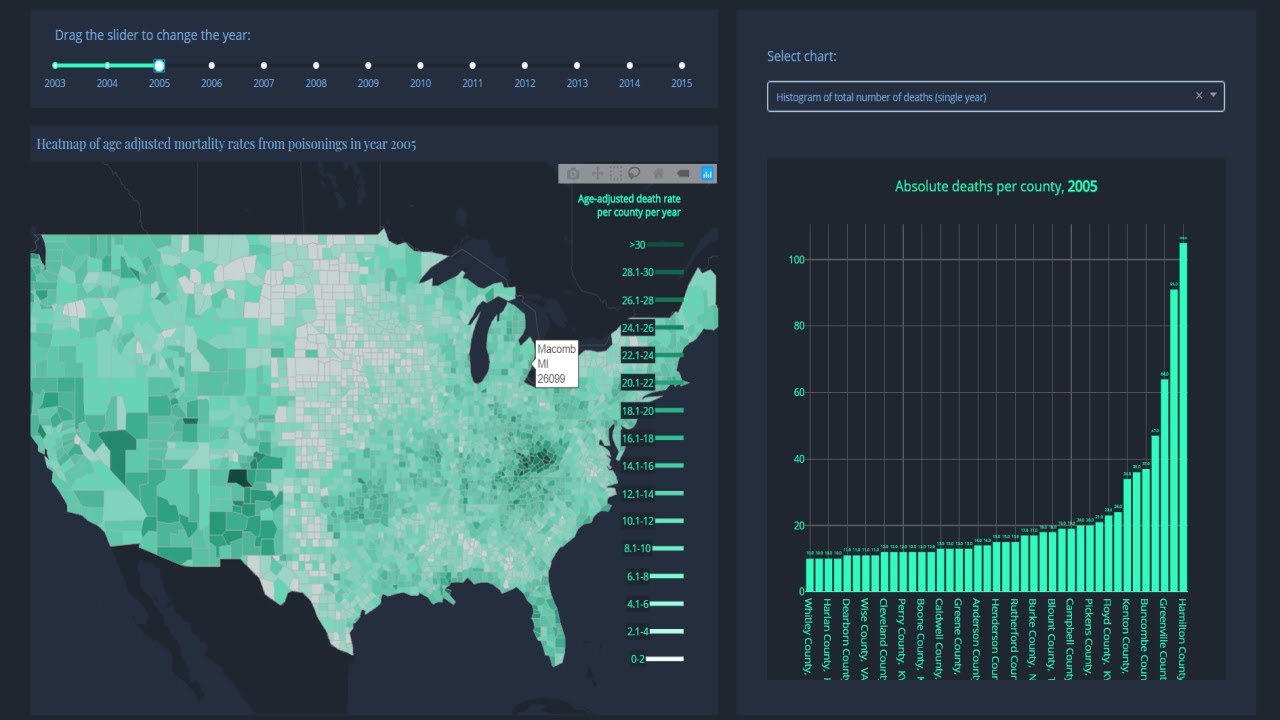
Using Plotly and Dash together opens up a wide range of possibilities for creating complex, interactive data visualizations. By combining the power of Plotly's visualization capabilities with Dash's web application framework, you can:
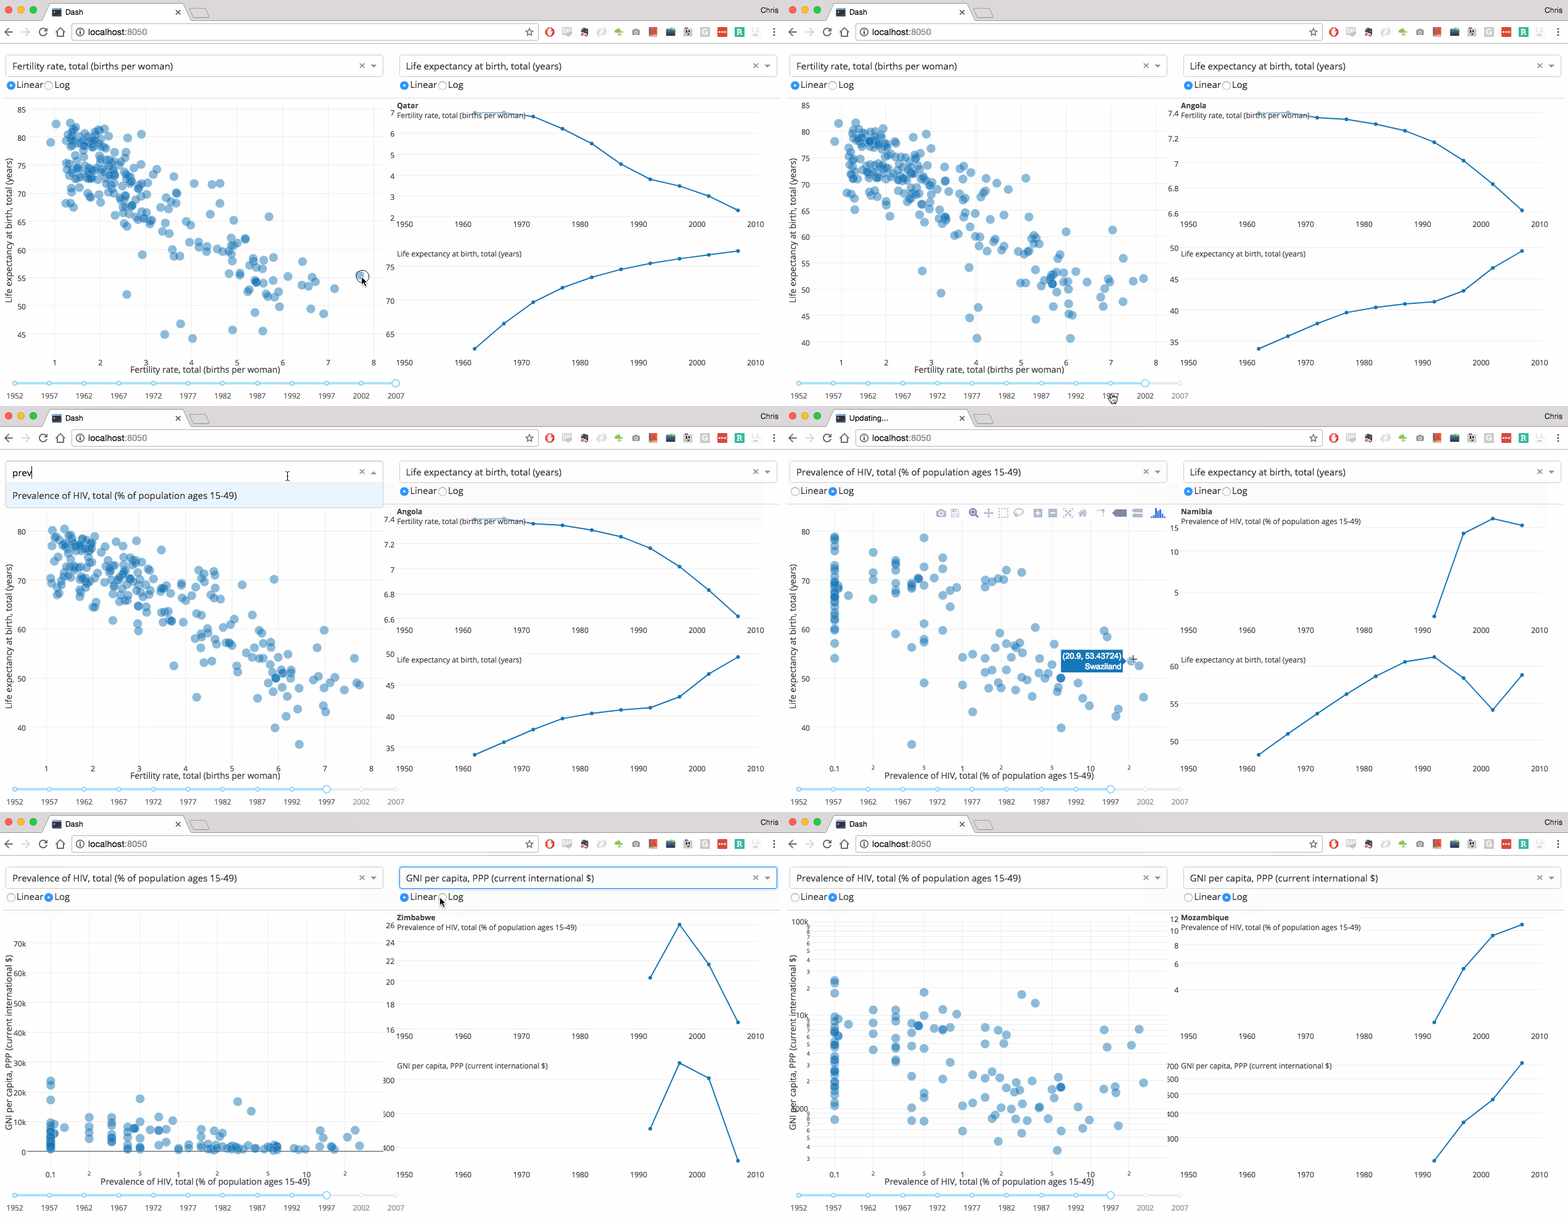
Create Interactive Visualizations: Plotly's interactive visualizations can be embedded within a Dash app, allowing users to hover over data points, zoom in/out, and even animate the plot.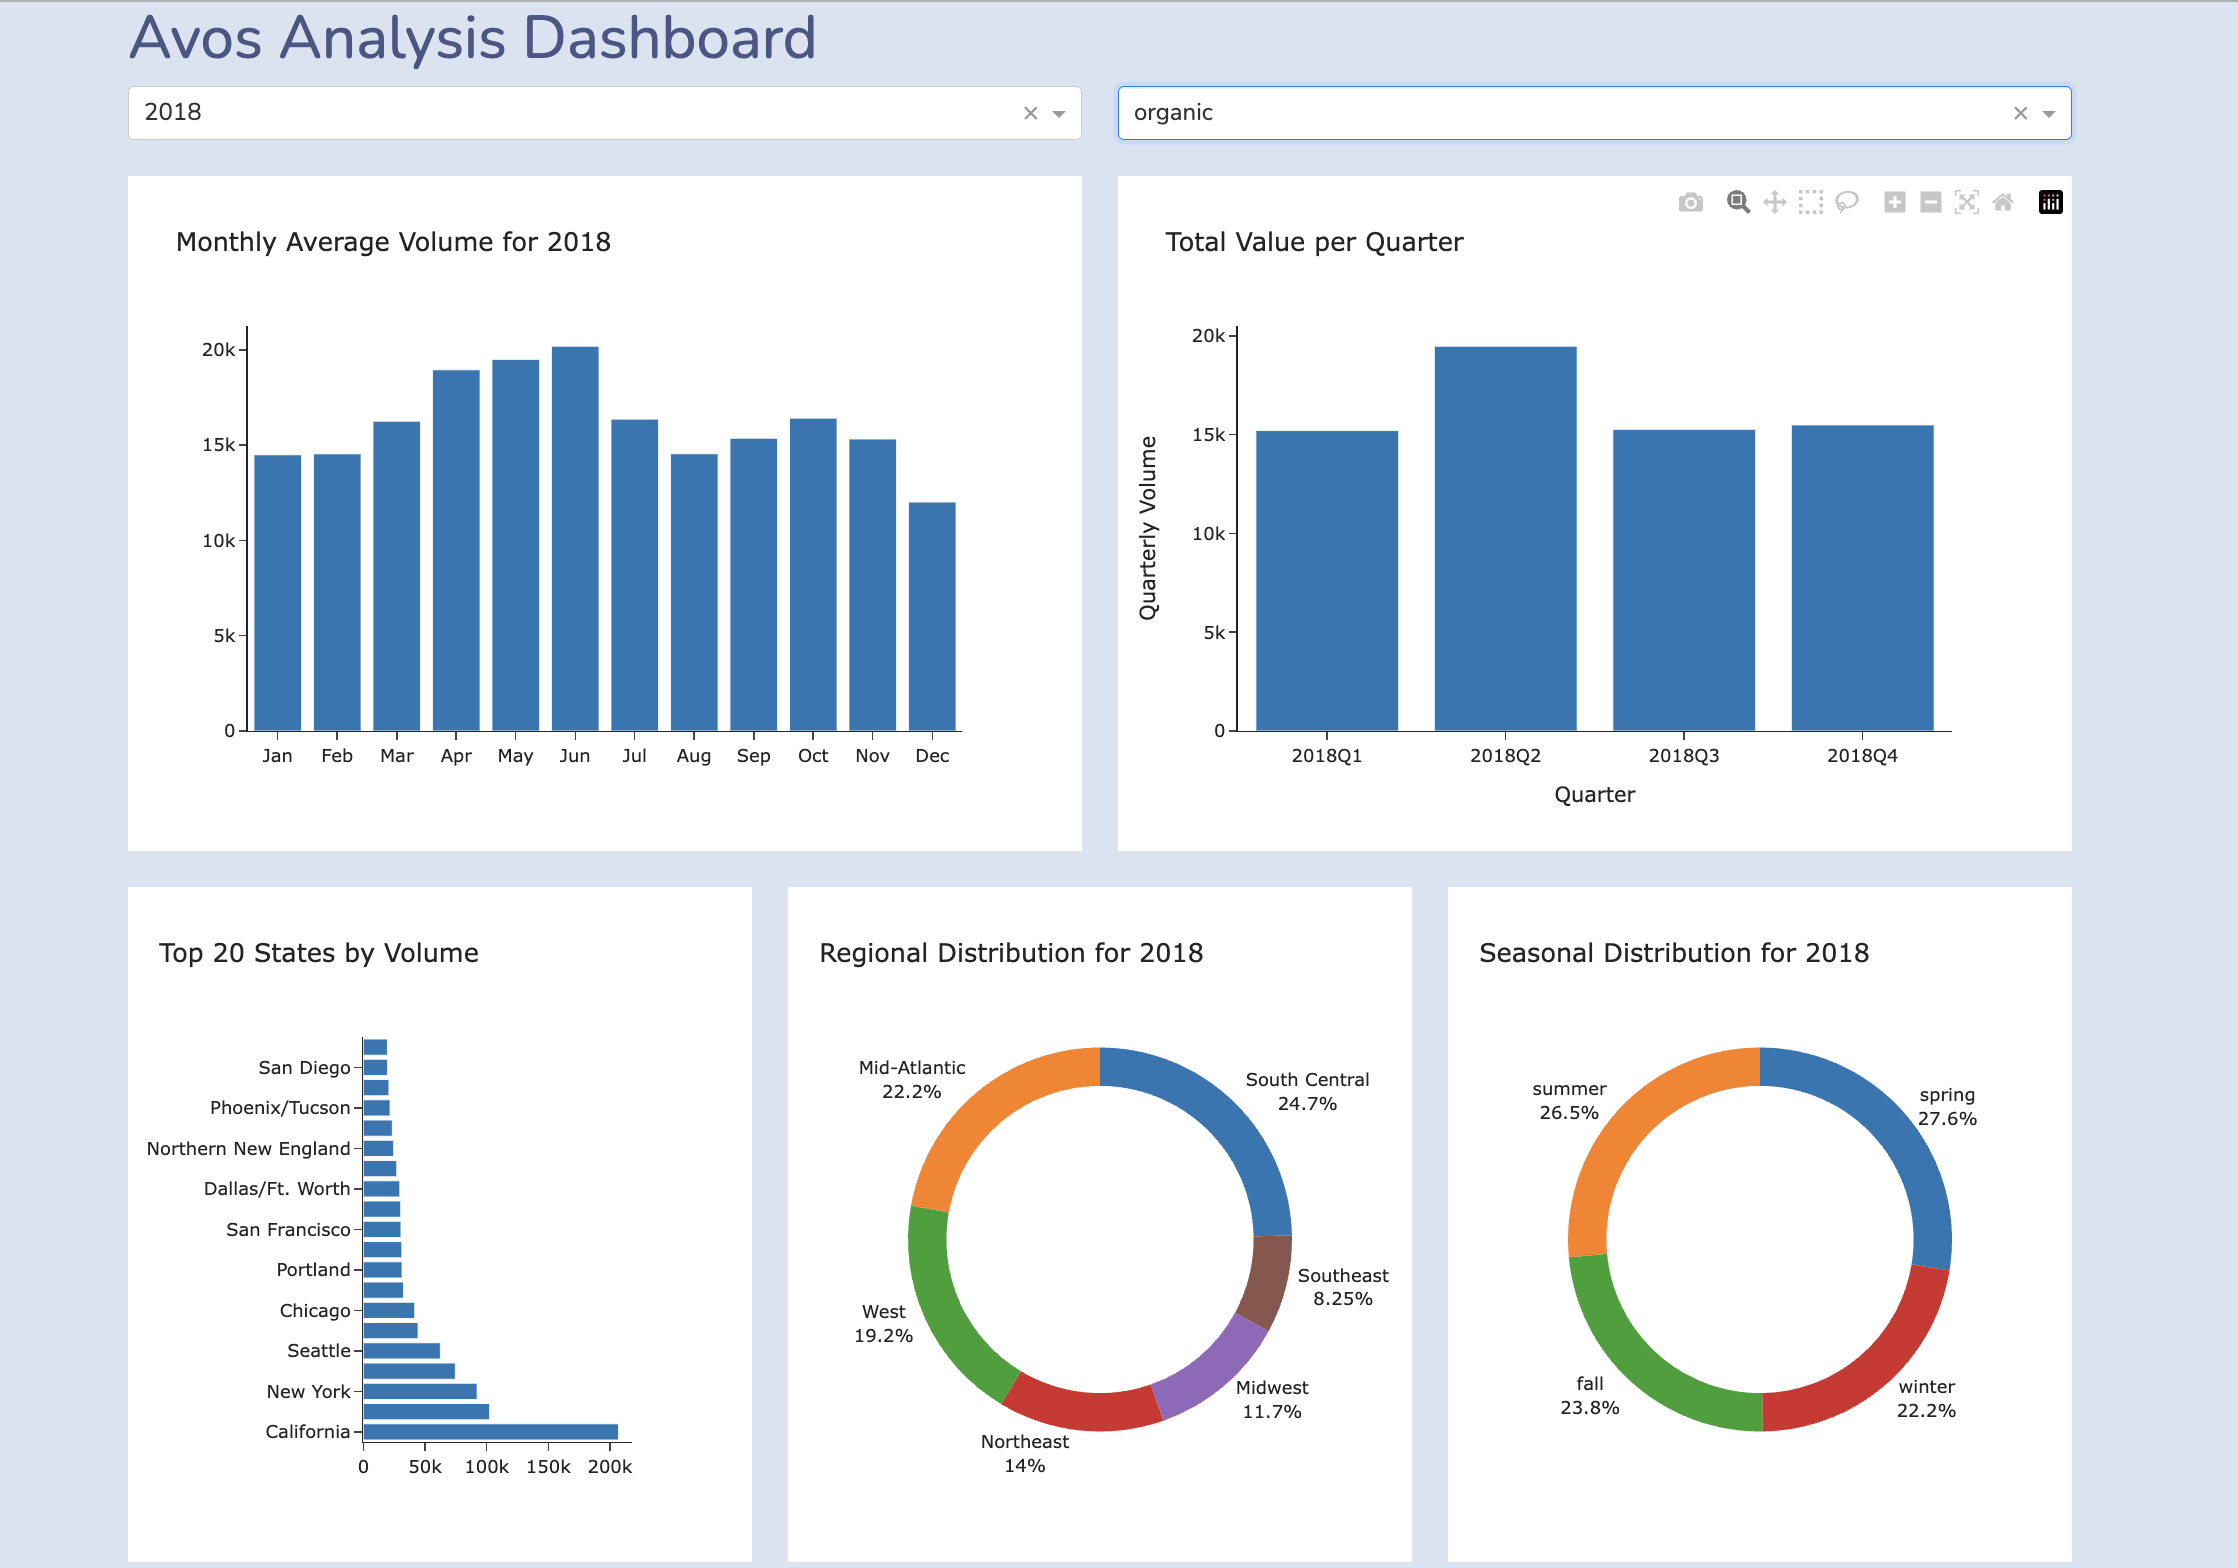
Getting Started with Plotly and Dash
To get started with using Plotly and Dash together, follow these steps:
Install the Libraries: Install Plotly and Dash using pip:pip install plotly dash
import plotly.graph_objects as go
from dash import Dash, html, dcc
dcc.Graph component to render your Plotly visualization:
app = Dash()
graph = dcc.Graph(id='your-graph')
app.layout = html.Div([graph])
if name == 'main':
app.run_server(debug=True)
go.Scatter, go.Bar) to create your visualization:
fig = go.Figure(data=[go.Scatter(x=x_values, y=y_values)])
dcc.Graph component:
graph = dcc.Graph(id='your-graph', figure=fig)
Example Code:
Here's a simple example of using Plotly and Dash together:
import plotly.graph_objects as go
from dash import Dash, html, dcc
app = Dash()
x_values = [1, 2, 3, 4]
y_values = [10, 20, 30, 40]
fig = go.Figure(data=[go.Scatter(x=x_values, y=y_values)])
graph = dcc.Graph(id='my-graph', figure=fig)
app.layout = html.Div([graph])
if name == 'main':
app.run_server(debug=True)
Conclusion
By combining the power of Plotly's visualizations with Dash's web application framework, you can create complex, interactive data visualizations that provide a richer user experience. In this guide, we've covered the basics of using Plotly and Dash together, including installing the libraries, creating your data, importing required libraries, creating a Dash app, and updating the app with your visualization.
I hope this helps you get started on your journey to create amazing data visualizations with Python's Plotly and Dash!
Is Plotly Python free?
I'd be happy to answer your question!
Plotly is a popular Python graphing library that allows users to create interactive, web-based visualizations. And the good news is... it's FREE!
Plotly was founded by Carando and Felliper in 2012 with the goal of creating a versatile and user-friendly data visualization tool. The company has continued to grow and improve its software over the years, and today Plotly is one of the most widely used Python libraries for data visualization.
So, what makes Plotly free? Well, there are a few reasons:
Open-source: Plotly is an open-source project, which means that anyone can contribute to its development, report bugs, or even modify its code to suit their needs. Free license: When you use Plotly, you're not required to pay any licensing fees or royalties. You can use it as much as you want, without worrying about additional costs. Community-driven: The Plotly community is active and dedicated, with many users contributing to the project through GitHub, forums, and social media channels. This collective effort ensures that the software remains free and open to all.Now, let's talk about what makes Plotly so useful:
Interactive visualizations: Plotly allows you to create interactive, web-based plots that can be shared with others or used for presentations. Wide range of plot types: Plotly supports over 40 different plot types, including line plots, scatter plots, bar charts, and more. Customizable: You can customize your plots by adjusting colors, fonts, and other parameters to match your brand or style. Python integration: As a Python library, Plotly integrates seamlessly with popular data analysis tools like Pandas, NumPy, and scikit-learn.In conclusion, Plotly is indeed free! With its open-source nature, community-driven development, and wide range of features, it's an excellent choice for anyone looking to create stunning data visualizations without breaking the bank. So go ahead, give Plotly a try – you won't regret it!
