plotly python tutorial
plotly python tutorial
Here is a comprehensive Python Tutorial on Plotly, with at least 300 words:
Introduction to Plotly
Plotly is an open-source library for creating interactive, web-based visualizations. It provides over 30 unique chart types, including line charts, scatter plots, bar charts, histograms, and more. With Plotly, you can create a wide range of interactive and static visualizations that can be shared with others.
Getting Started with Plotly
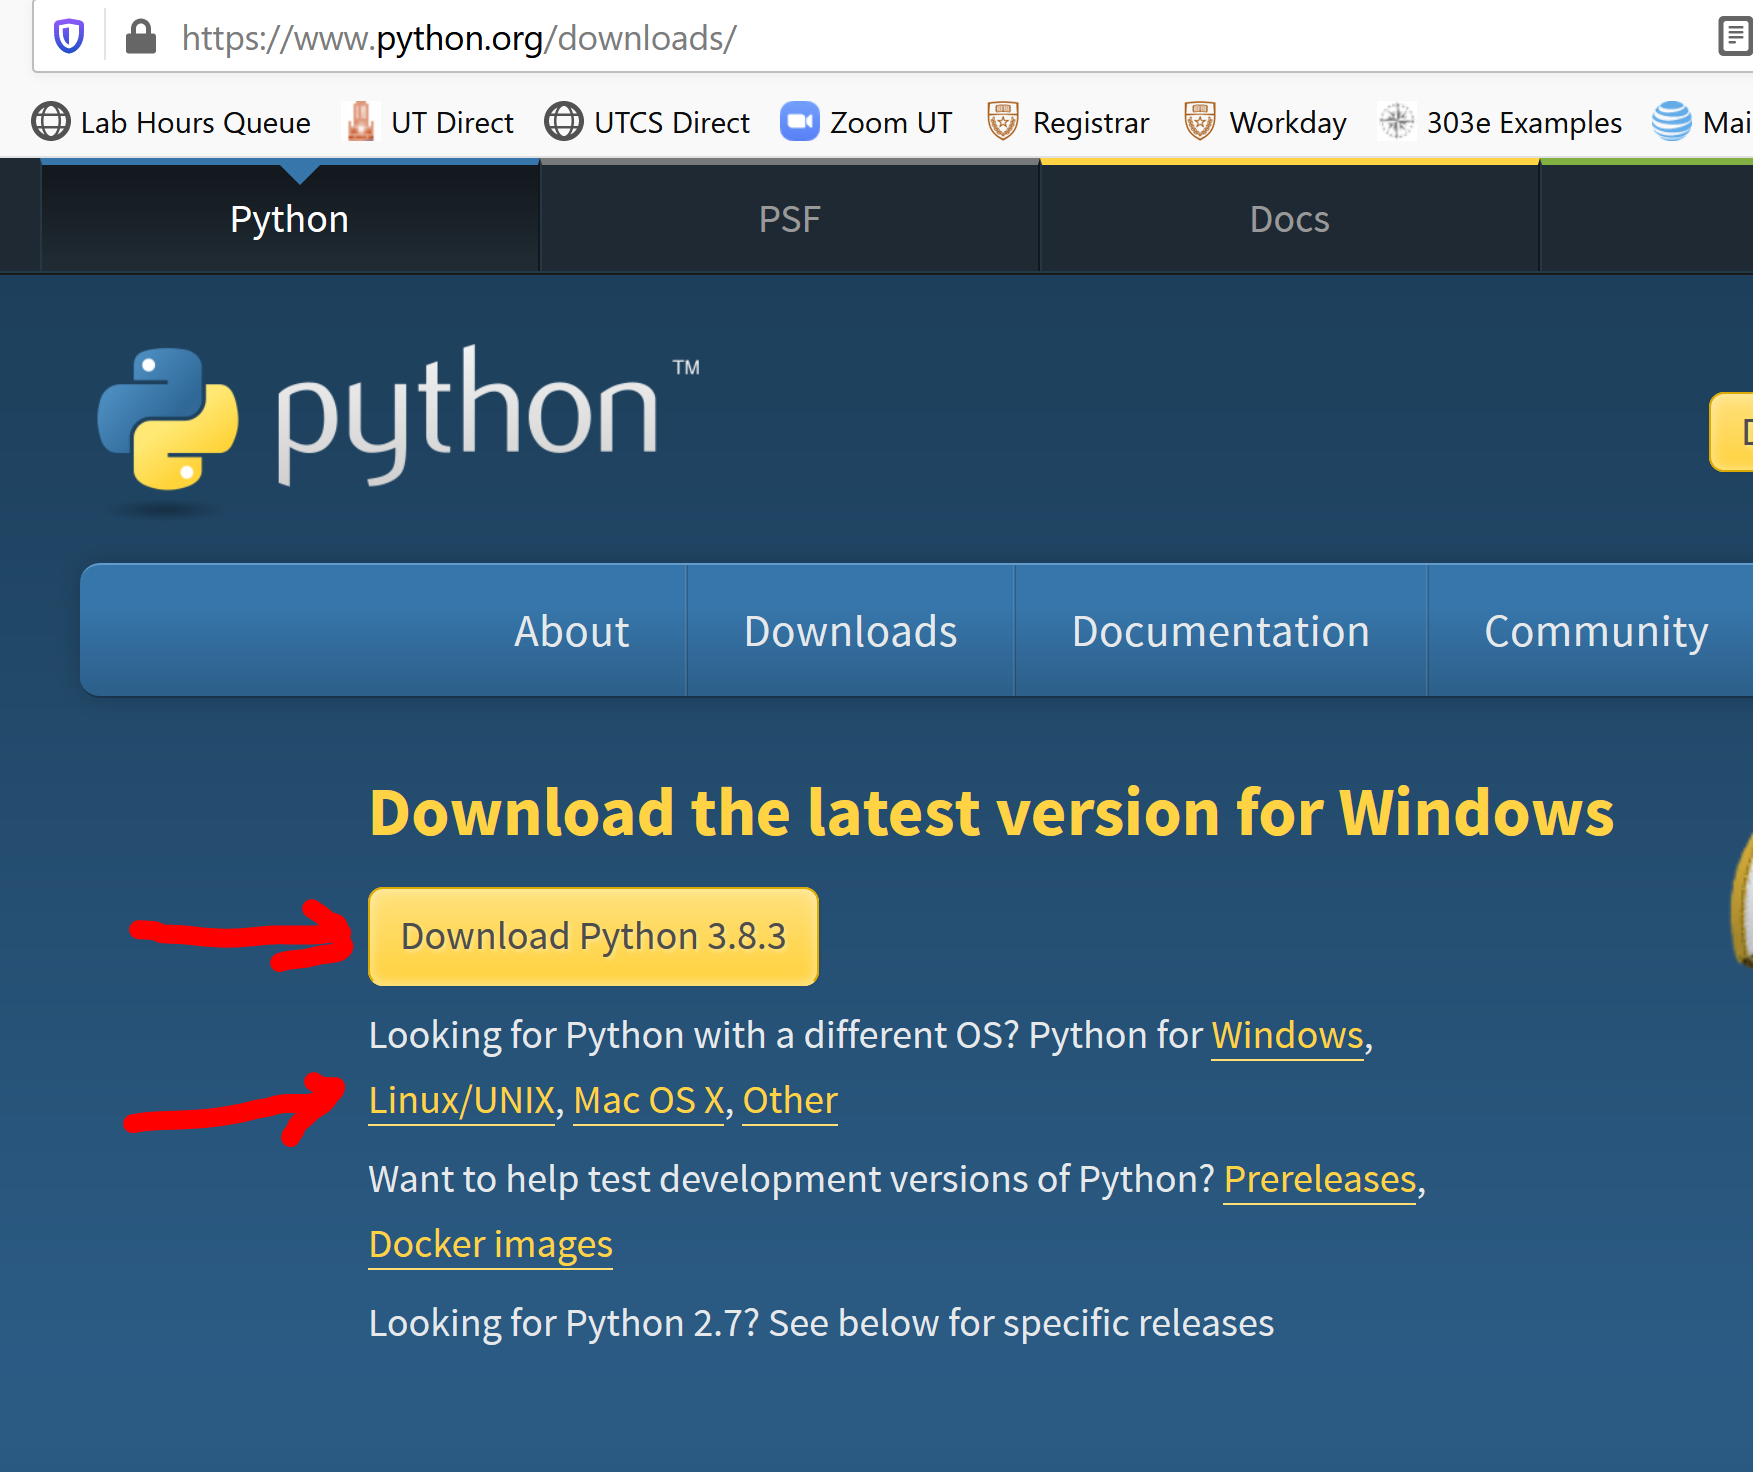
To use Plotly, you need to install the library first. You can do this using pip, Python's package manager:
pip install plotly
Once installed, you can start creating plots!
Here is a simple example of how to create a line chart with Plotly:
import plotly.graph_objects as go
x = [1, 2, 3, 4, 5]
y = [10, 20, 30, 40, 50]
fig = go.Figure(data=[go.Scatter(x=x, y=y)])
fig.show()
This code will create a simple line chart with the x-axis values ranging from 1 to 5 and the y-axis values ranging from 10 to 50.
Customizing Your Plot
Now that you have created your first plot, let's customize it!
Here are some ways you can customize your plot:
Title: You can add a title to your plot using thetitle attribute.
fig = go.Figure(data=[go.Scatter(x=x, y=y)])
fig.update_layout(title='My Line Chart')
fig.show()
xaxis_title and yaxis_title attributes.
fig = go.Figure(data=[go.Scatter(x=x, y=y)])
fig.update_layout(xaxis_title='X-Axis', yaxis_title='Y-Axis')
fig.show()
line_color attribute.
fig = go.Figure(data=[go.Scatter(x=x, y=y, line_color='red')])
fig.show()
Creating More Complex Plots
Now that you have created a simple line chart, let's create some more complex plots!
Here are some examples of how to create different types of plots:
Bar Chart: You can create a bar chart by using thebar function.
import plotly.graph_objects as go
x = [1, 2, 3, 4, 5]
y = [10, 20, 30, 40, 50]
fig = go.Figure(data=[go.Bar(x=x, y=y)])
fig.show()
scatter function.
import plotly.graph_objects as go
x = [1, 2, 3, 4, 5]
y = [10, 20, 30, 40, 50]
fig = go.Figure(data=[go.Scatter(x=x, y=y)])
fig.show()
histogram function.
import plotly.graph_objects as go
x = [1, 2, 3, 4, 5]
fig = go.Figure(data=[go.Histogram(x=x, nbinsx=10)])
fig.show()
Sharing Your Plot
Now that you have created your plot, let's share it with others!
Here are some ways you can share your plot:
Save as an Image: You can save your plot as an image using thewrite_image function.
import plotly.graph_objects as go
x = [1, 2, 3, 4, 5]
y = [10, 20, 30, 40, 50]
fig = go.Figure(data=[go.Scatter(x=x, y=y)])
Save the plot to a file
fig.write_image('plotly_plot.png')
View the plot in your browser
fig.show()
show function.
import plotly.graph_objects as go
x = [1, 2, 3, 4, 5]
y = [10, 20, 30, 40, 50]
fig = go.Figure(data=[go.Scatter(x=x, y=y)])
Share the plot in your browser
fig.show()
That's it! With these examples and tips, you should be well on your way to creating a wide range of interactive and static visualizations using Plotly.
What is the difference between Matplotlib and Plotly in Python?
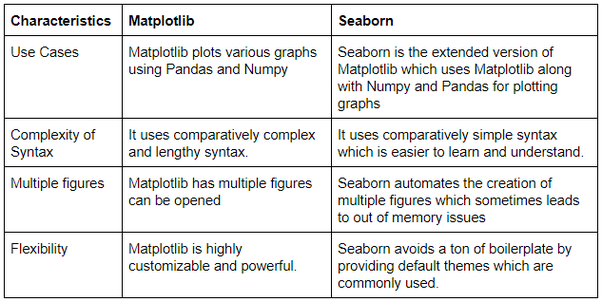
Matplotlib and Plotly are two popular data visualization libraries in Python that allow users to create high-quality plots, charts, and graphs. While they share some similarities, there are distinct differences between the two.
Matplotlib
Matplotlib is a widely used and well-established plotting library for creating static, animated, and interactive visualizations in Python. It's known for its simplicity, flexibility, and extensive range of features. Matplotlib provides:
Static plots: Users can create various types of static plots, such as line plots, scatter plots, bar charts, histograms, and more.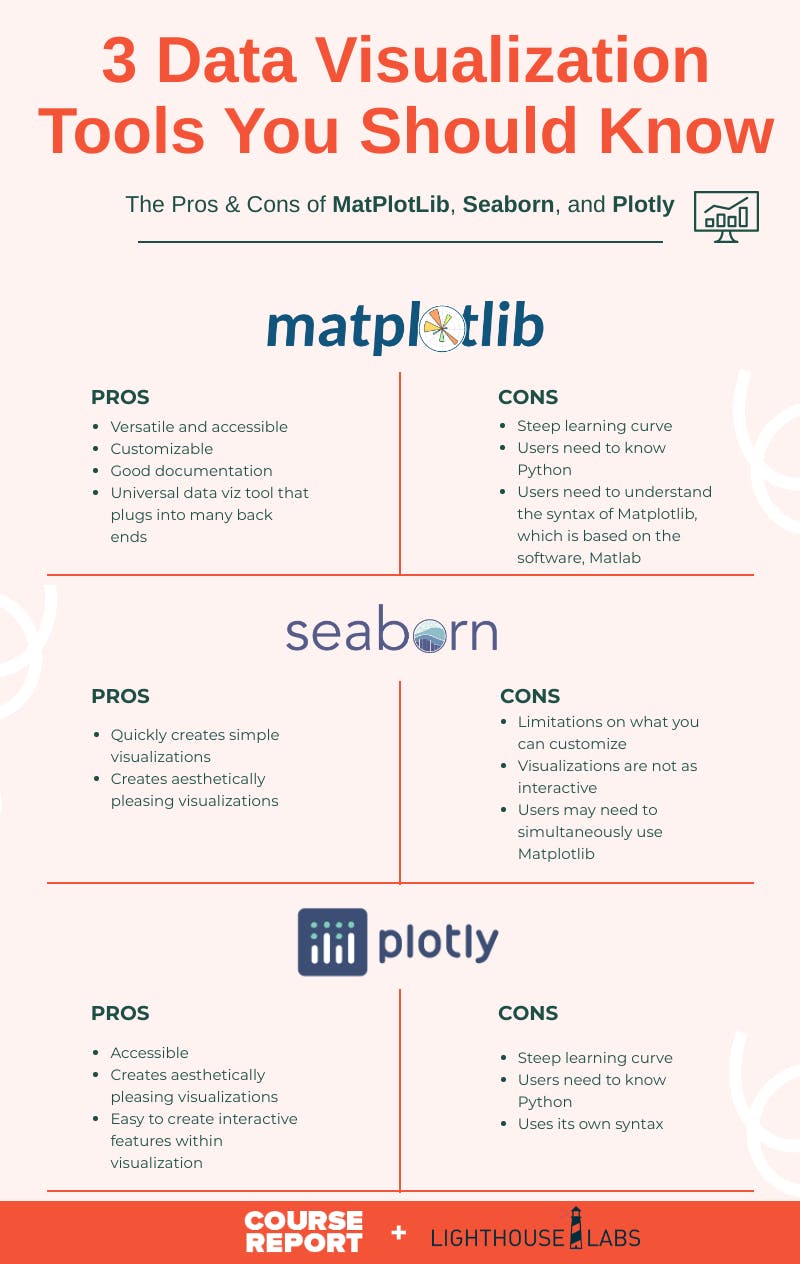
Plotly
Plotly is a Python library that focuses on interactive visualizations and provides a more user-friendly interface for creating plots. Plotly's key features include:
Interactive plots: Plotly allows users to create highly customizable, interactive plots that can be zoomed in, panned, and hovered over. Web-based publishing: Users can publish their plots directly to the web or share them via email or social media platforms. Support for multiple formats: Plotly supports various output formats, including HTML, PNG, PDF, and more. Integration with Jupyter Notebooks: Plotly integrates seamlessly with Jupyter Notebooks, enabling users to create interactive visualizations directly within their notebooks.Key differences
Interactive vs. Static: Matplotlib focuses on creating static plots, while Plotly emphasizes interactive visualizations. Customization level: Matplotlib provides more extensive customization options compared to Plotly's more straightforward interface. Output format: Matplotlib primarily outputs static images (PNG, PDF), whereas Plotly supports a range of formats and interactive publishing. Ease of use: Plotly is generally considered easier to learn and use, especially for users without extensive experience with data visualization.When to choose each library
Use Matplotlib: For creating static plots that require fine-grained customization. When you need more control over plot elements and layout. Use Plotly: For creating interactive visualizations that require user engagement. When you want to share your plots with others through web-based publishing.In summary, Matplotlib is ideal for creating customized static plots, while Plotly excels at generating interactive visualizations that can be easily shared and published. Ultimately, the choice between these libraries depends on the specific needs of your project and personal preference.
