How to add matplotlib to Python?
How to add matplotlib to Python?
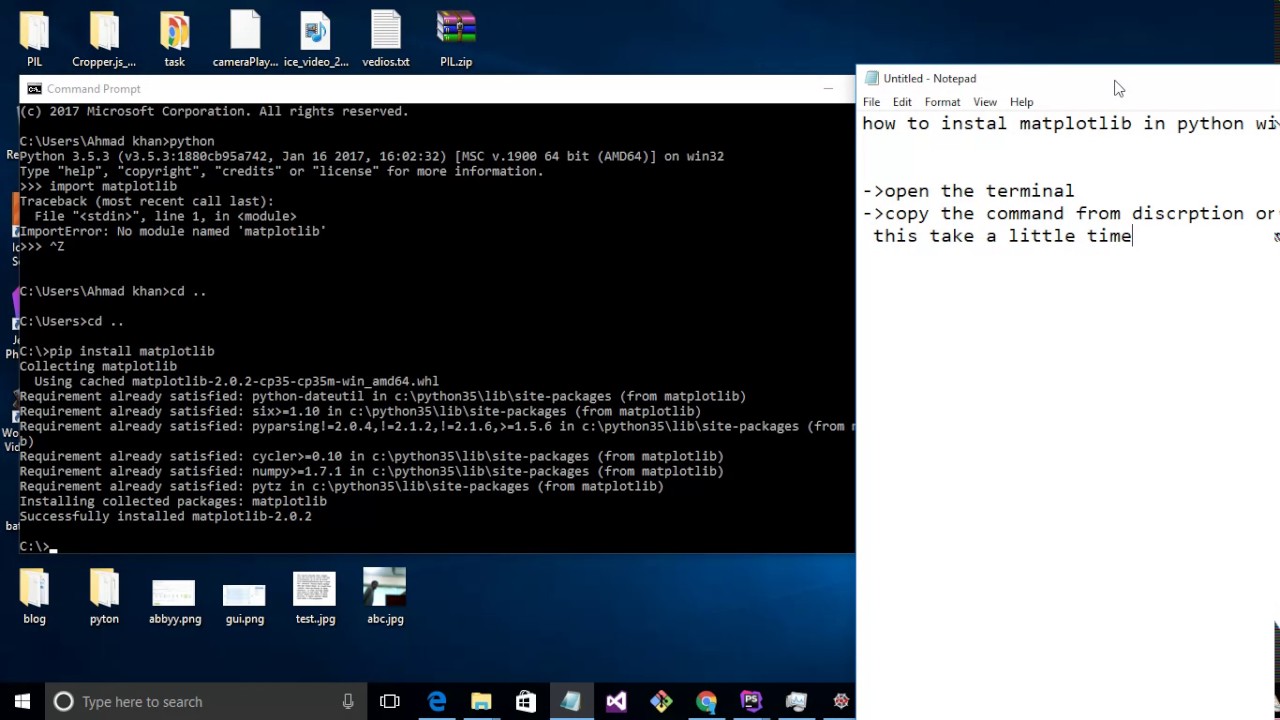
Here are the steps to install and use matplotlib:
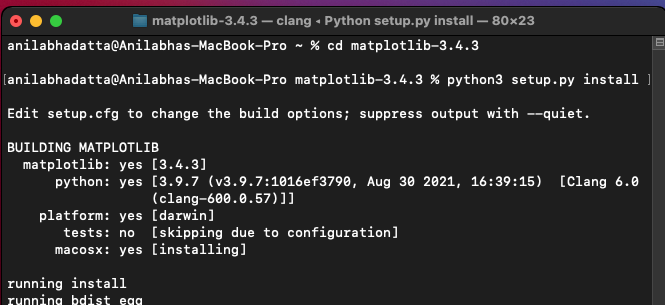
Step 1: Install Matplotlib
To install matplotlib, you can use pip, which is a package installer for Python. Open your command prompt or terminal, navigate to the directory where you want to install matplotlib, and type:
pip install matplotlib
This will download and install matplotlib and its dependencies.
Step 2: Import Matplotlib
To start using matplotlib, you need to import it into your Python script. You can do this by adding the following line of code at the top of your script:
import matplotlib.pyplot as plt
The as plt part assigns a nickname (plt) to the module, which is useful when you want to use multiple plotting libraries.
Step 3: Create a Plot
Matplotlib provides various functions for creating different types of plots. For example:
plot() function for line plots bar() function for bar charts hist() function for histograms scatter() function for scatter plots
Here is an example code snippet that creates a simple line plot:
import matplotlib.pyplot as plt
import numpy as np
Create some data
x = np.linspace(0, 10, 100)
y = np.sin(x)
Create the plot
plt.plot(x, y)
Show the plot
plt.show()
This code creates a line plot of the sine function from 0 to 10.
Step 4: Customize Your Plot
Matplotlib provides many options for customizing your plot. Some common ones include:
Setting titles and labels using thetitle(), xlabel(), and ylabel() functions Changing the appearance of the plot using the figure(), axis() ,and legend() functions Adding gridlines, axis lines, and more
For example:
import matplotlib.pyplot as plt
import numpy as np
Create some data
x = np.linspace(0, 10, 100)
y = np.sin(x)
Create the plot
plt.plot(x, y)
plt.title("Sine Wave")
plt.xlabel("X-axis")
plt.ylabel("Y-axis")
Show the plot
plt.show()
This code adds a title, x-axis label, and y-axis label to the plot.
Step 5: Save Your Plot
To save your plot to a file, you can use the savefig() function. For example:
import matplotlib.pyplot as plt
import numpy as np
Create some data
x = np.linspace(0, 10, 100)
y = np.sin(x)
Create the plot
plt.plot(x, y)
Save the plot to a file
plt.savefig("sine_wave.png")
Show the plot
plt.show()
This code saves the plot to a file named "sine_wave.png".
That's it! With these steps, you should be able to install and use matplotlib in your Python script. Happy plotting!
How to import matplotlib in Python VSCode

I'll be happy to help you with that!
Importing Matplotlib in Python VSCode is a straightforward process. Here's a step-by-step guide:
Method 1: Install Matplotlib using pip
Open your terminal or command prompt in VSCode by pressingCtrl + (backtick) and typing terminal then press Enter. In the terminal, type pip install matplotlib and press Enter. This will download and install Matplotlib along with its dependencies. Once the installation is complete, you can verify that Matplotlib has been installed correctly by running python -c "import matplotlib; print(matplotlib.__version__)" in your terminal.

Method 2: Install Matplotlib using conda
If you're using Anaconda or Miniconda, you can install Matplotlib using conda. Open your terminal or command prompt and typeconda install matplotlib then press Enter.
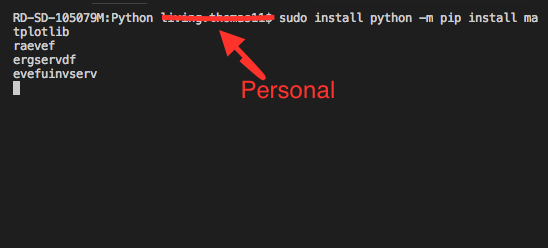
python -c "import matplotlib; print(matplotlib.__version__)" in your terminal.
Method 3: Install Matplotlib using Jupyter Notebook
If you're using Jupyter Notebook, you can install Matplotlib from within the notebook. Open a new notebook and type!pip install matplotlib then press Shift+Enter to run the cell. Once the installation is complete, you can verify that Matplotlib has been installed correctly by running import matplotlib; print(matplotlib.__version__) in a new cell.
Adding Matplotlib to your Python environment
After installing Matplotlib using any of the above methods, you need to add it to your Python environment. To do this, open your VSCode settings.json file by clicking on the three dots at the top right corner of the window and selectingOpen Settings File. In the file, add the following lines:
{
"python.analysis.extraLibraries": ["path_to_your_matplotlib_installation"],
"python.linting.pylintEnabled": true
}
"path_to_your_matplotlib_installation" with the actual path where Matplotlib was installed.
Using Matplotlib in your Python script
Now that you've installed and added Matplotlib to your Python environment, you can use it in your scripts. Open a new Python file in VSCode and add the following code:import matplotlib.pyplot as plt
x = [1, 2, 3, 4]
y = [5, 6, 7, 8]
plt.plot(x, y)
plt.show()
Run Code button or pressing F5. You should see a simple line plot displayed in your VSCode window.
That's it! With these steps, you should be able to import and use Matplotlib in your Python scripts within VSCode.
