Pandas stands for in Python
Pandas stands for in Python
Pandas is a popular open-source data manipulation and analysis library in the Python programming language. It is built on top of the NumPy extension to the Python standard library, which provides high-performance, multidimensional arrays and matrices.
Pandas was created by Wes McKinney in 2008 as an extension to the Python programming language. The name "pandas" comes from the term "panel data," a type of data that is commonly used in econometrics and statistics. The library was designed to make it easy to manipulate and analyze data, particularly tabular data such as spreadsheets or relational databases.
One of the key features of Pandas is its ability to handle missing data values. This is achieved through the use of a null value placeholder called "NaN" (not a number). NaN allows for efficient handling of missing data points in datasets, which can be useful when performing statistical analysis or machine learning tasks on real-world data.
Pandas also includes tools for merging and joining different datasets together, as well as for reshaping and pivoting data from one format to another. For example, it is possible to reshape a dataset from wide (rows are individual records) to long (rows are observations) format using the melt function in Pandas. This can be useful when performing statistical analysis or creating reports.
Another important feature of Pandas is its ability to handle different types of data formats and sources. For example, it is possible to read and write CSV (comma-separated values) files, Excel spreadsheets, JSON (JavaScript Object Notation) data, and SQL databases using the pandas library. This makes it easy to integrate Pandas with other tools and libraries in the Python ecosystem.
Some common use cases for Pandas include:
Data cleaning: Removing missing or duplicate data points from a dataset. Data analysis: Performing statistical analysis on a dataset to identify trends and patterns. Data visualization: Creating charts, plots, and graphs of data using popular libraries such as Matplotlib or Seaborn. Data manipulation: Reshaping, pivoting, and transforming data from one format to another. Machine learning: Using Pandas in conjunction with scikit-learn or TensorFlow for machine learning tasks.Some of the key benefits of using Pandas include:
Fast performance: Pandas is built on top of NumPy, which provides high-performance arrays and matrices. Easy data manipulation: Pandas includes a range of tools for manipulating data, including merging and joining datasets, reshaping data, and handling missing values. Flexibility: Pandas can handle different types of data formats and sources, making it easy to integrate with other libraries in the Python ecosystem. Large community: Pandas has a large and active community of users and developers, which means there are many resources available for learning and troubleshooting.Overall, Pandas is an incredibly powerful tool that makes it easy to manipulate and analyze data in Python. Whether you're a seasoned data scientist or just starting out with data analysis, Pandas is definitely worth exploring further!
How to connect pandas with Python?
I'd be happy to help!
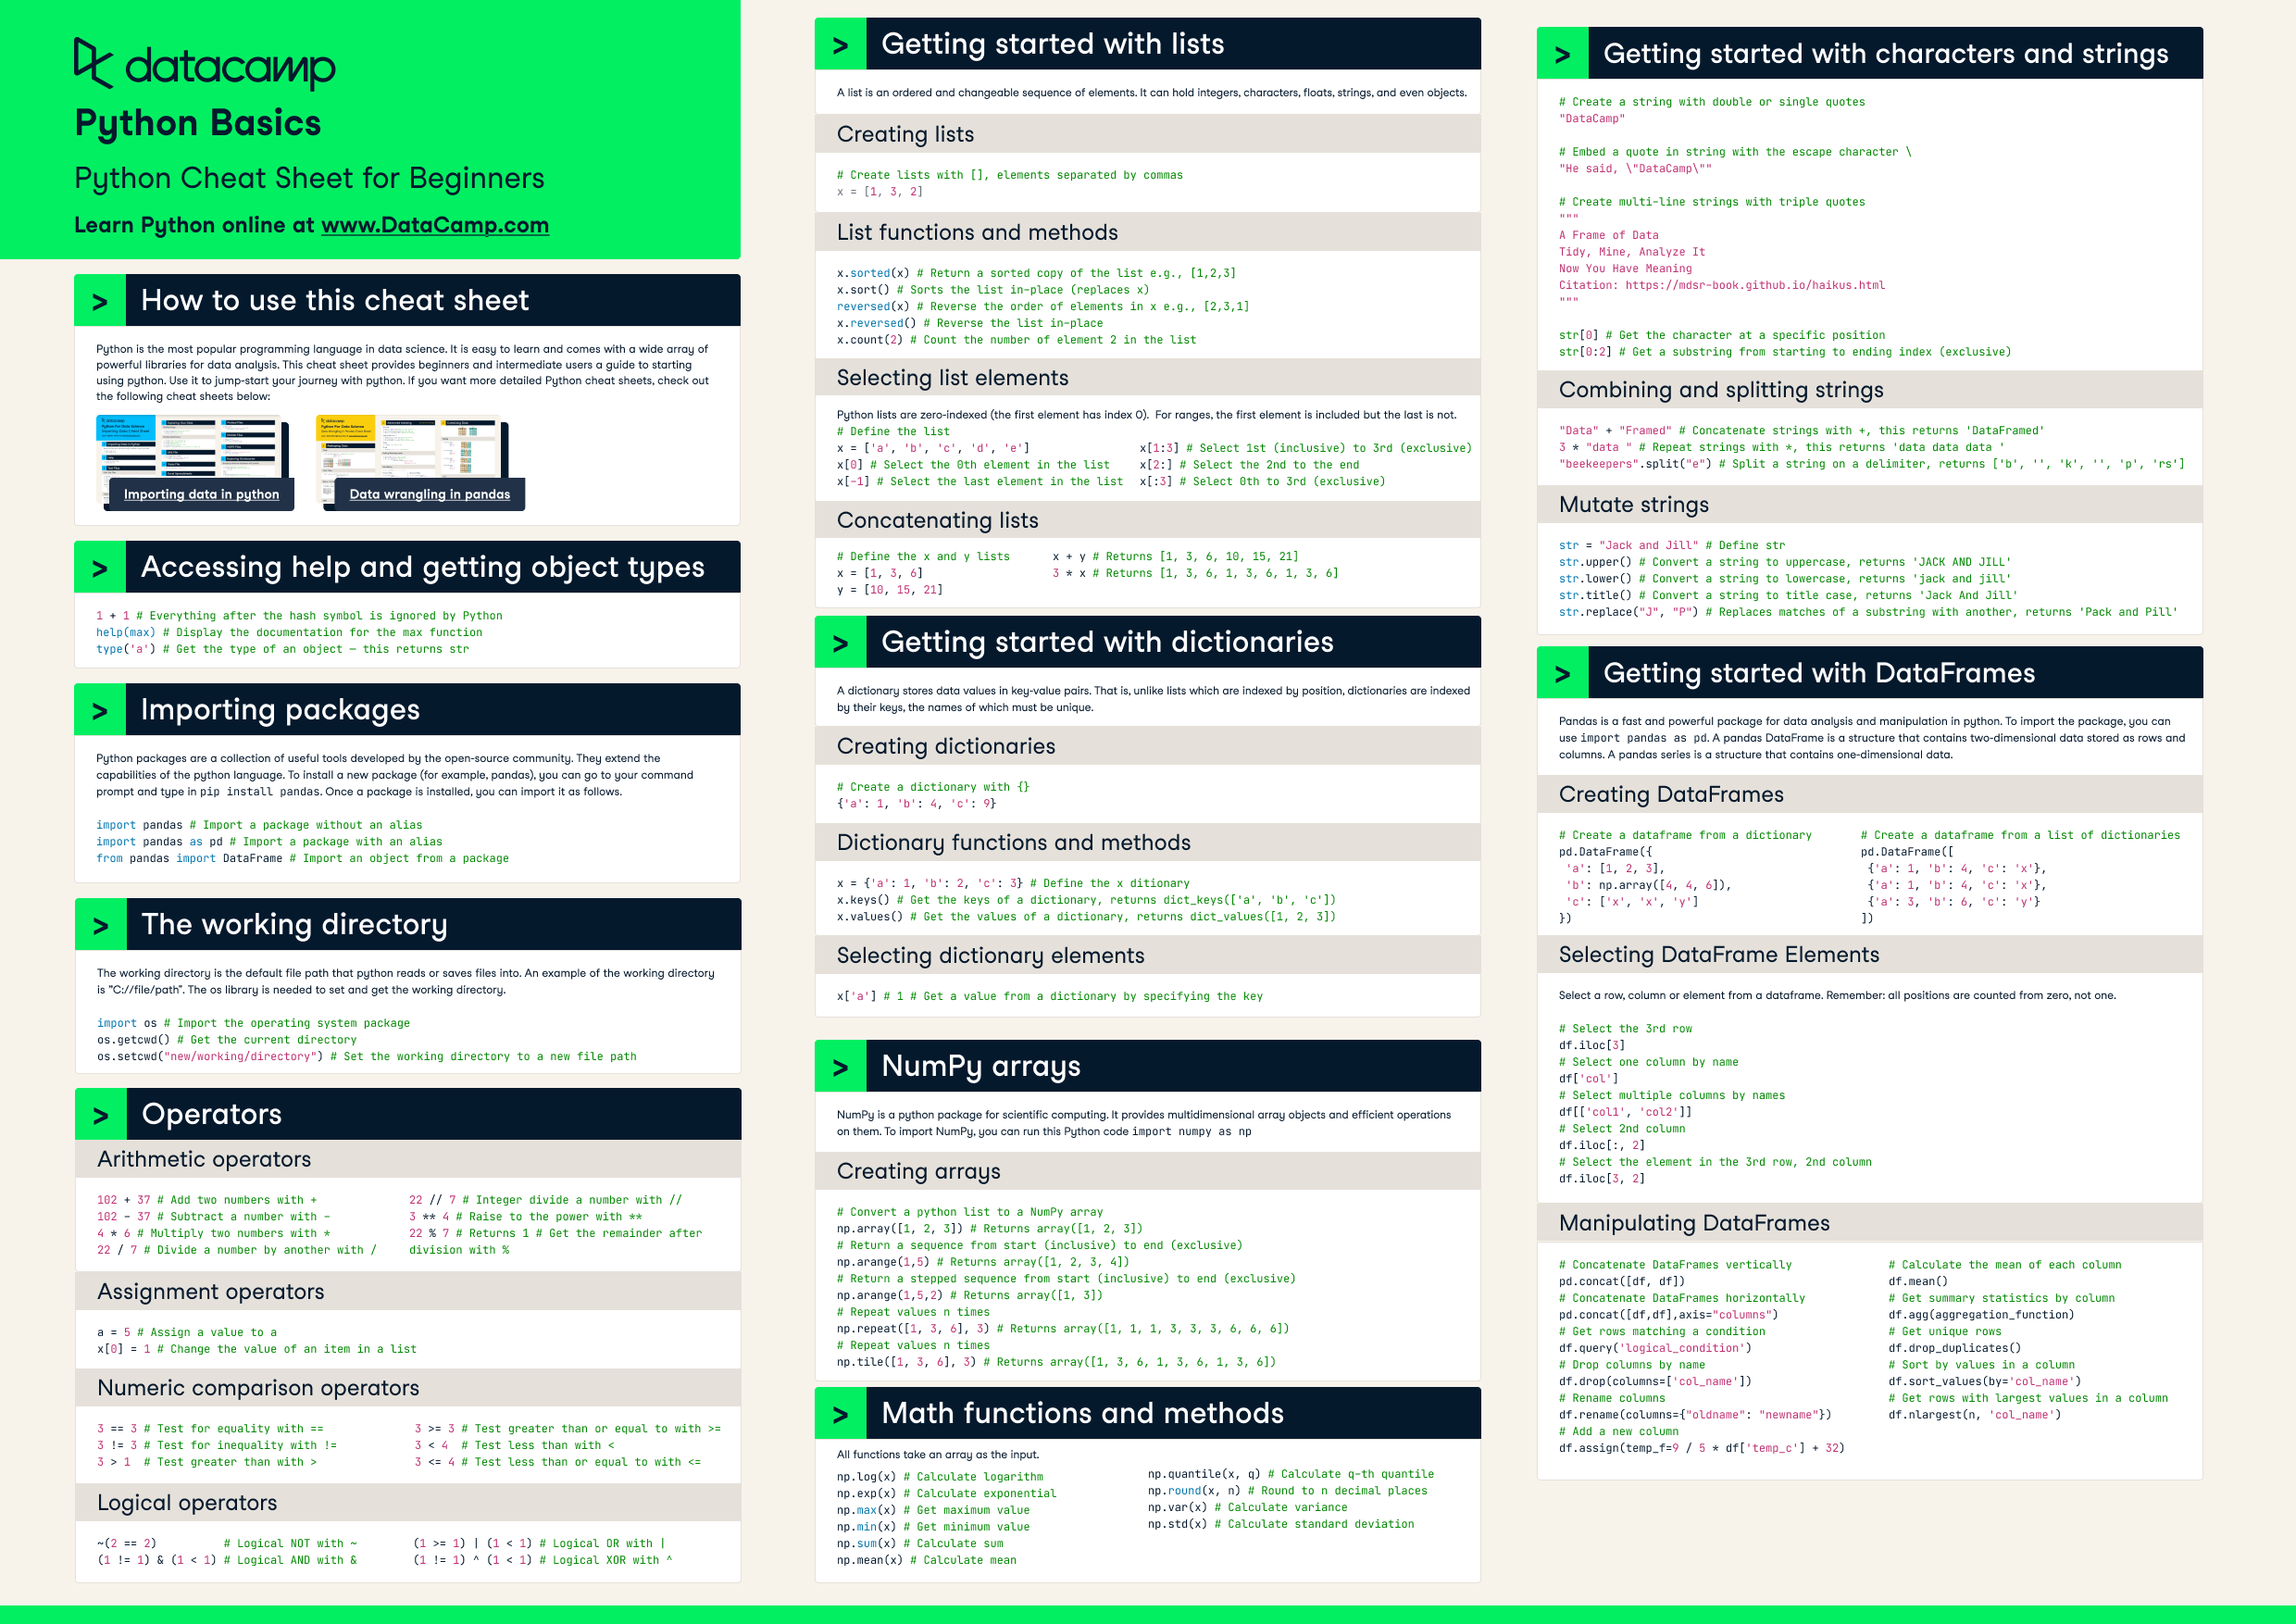
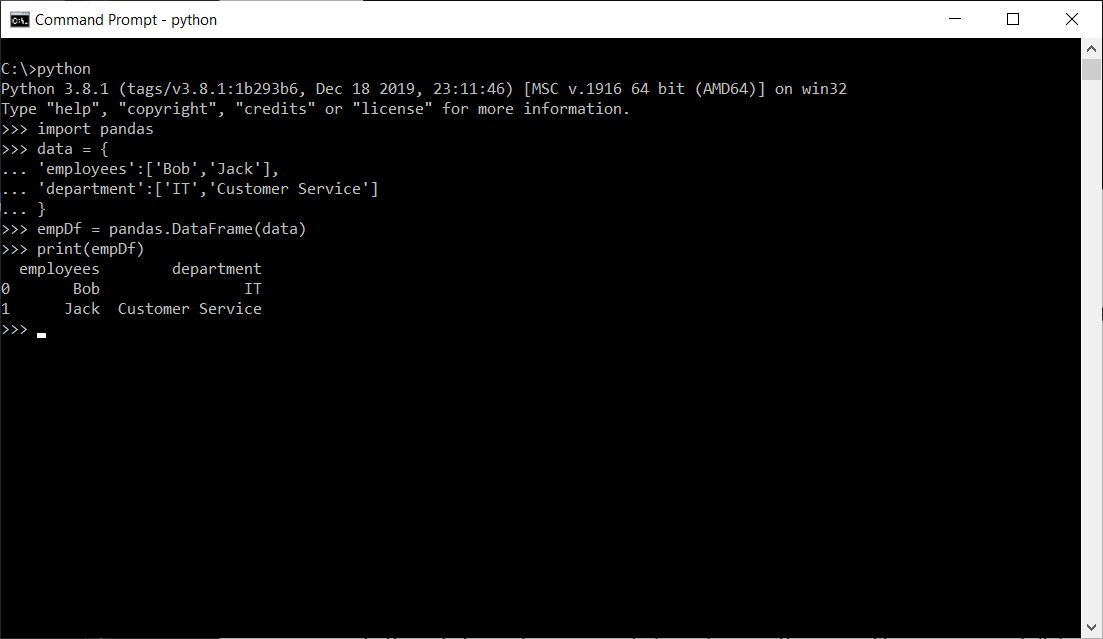
To connect Pandas with Python, you can simply import the Pandas library (pandas) within your Python script or program. Here's a step-by-step guide:
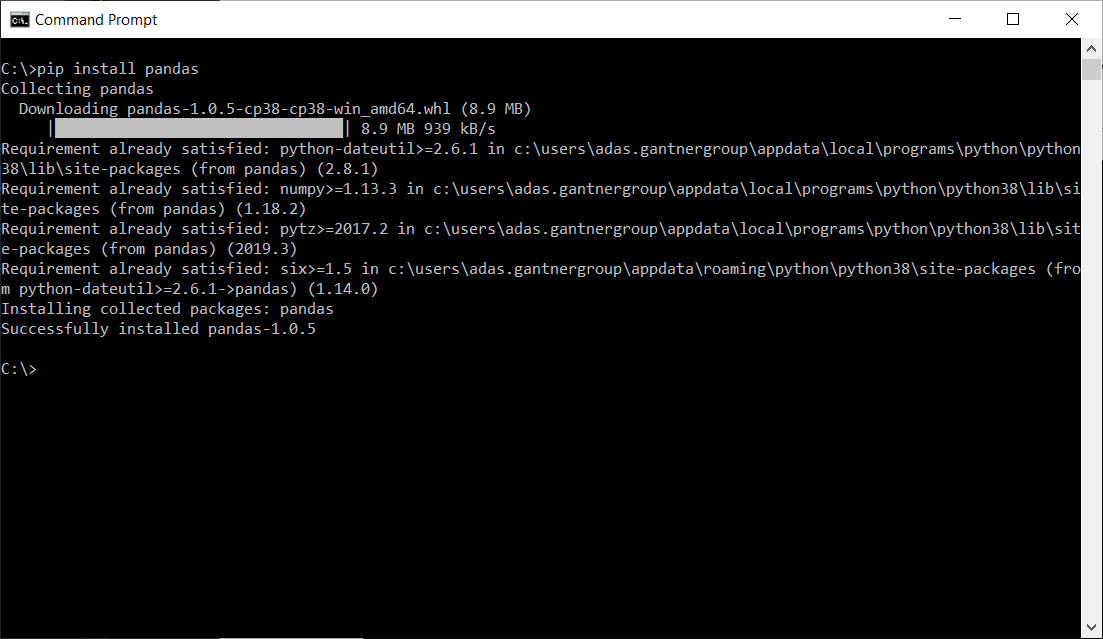
1. Install Pandas:
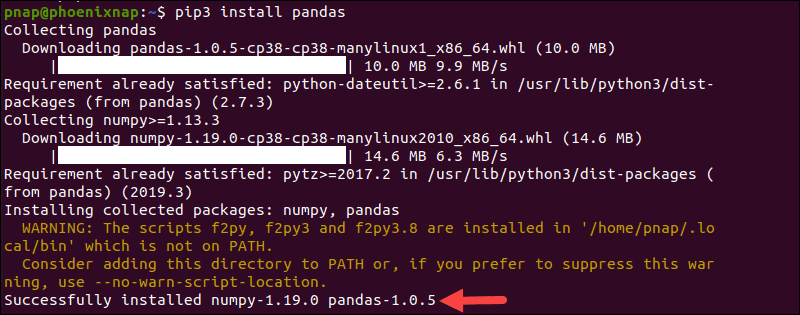
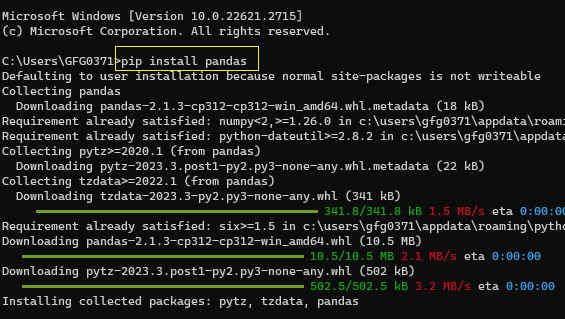
Firstly, ensure that you have installed Pandas on your system. You can install it using pip, the Python package manager:
pip install pandas
2. Import Pandas:
Once installed, you can import Pandas in your Python script or program by adding this line at the top of your code:
import pandas as pd
The as pd part assigns the alias pd to the imported library, making it easier to reference functions and data structures within the Pandas library.
3. Load Data:
Now you're ready to load your data into Pandas! You can do this using various methods:
a. Reading CSV files: Use the read_csv() function:
df = pd.read_csv('your_file.csv')
b. Reading Excel files: Use the read_excel() function:
df = pd.read_excel('your_file.xlsx')
c. Creating DataFrames from scratch: Initialize an empty DataFrame and populate it with data manually or using other Python libraries (e.g., NumPy):
data = {'Name': ['John', 'Mary', 'Bob'],
'Age': [25, 31, 42]}
df = pd.DataFrame(data)
4. Manipulate Data:
Now that your data is loaded into a DataFrame, you can perform various operations:
a. Selecting data: Use the loc[] or iloc[] methods to filter rows based on conditions:
young_people = df.loc[df['Age'] < 30]
b. Filtering by multiple columns: Combine conditions using logical operators (e.g., &, |):
old_men = df.loc[(df['Age'] > 50) & (df['Name'].str.contains('John'))]
c. Grouping and aggregating data: Use the groupby() method:
avg_age_per_name = df.groupby('Name')['Age'].mean()
d. Sorting and rearranging data: Use the sort_values() method:
df_sorted = df.sort_values(by='Age', ascending=False)
5. Saving Data:
Finally, you can save your processed data to various formats:
a. Saving as CSV files: Use the to_csv() method:
df.to_csv('output.csv', index=False)
b. Saving as Excel files: Use the to_excel() method:
df.to_excel('output.xlsx', index=False)
c. Saving to other formats: Explore additional options like JSON, HDF5, or SQL databases using various libraries (e.g., json, h5py, sqlite3).
In this example, you've seen how to connect Pandas with Python, load data, manipulate data, and save the results. With these basic operations under your belt, you're ready to tackle more complex tasks in data analysis, machine learning, or data visualization!
