How do I install SciPy for Python?
How do I install SciPy for Python?
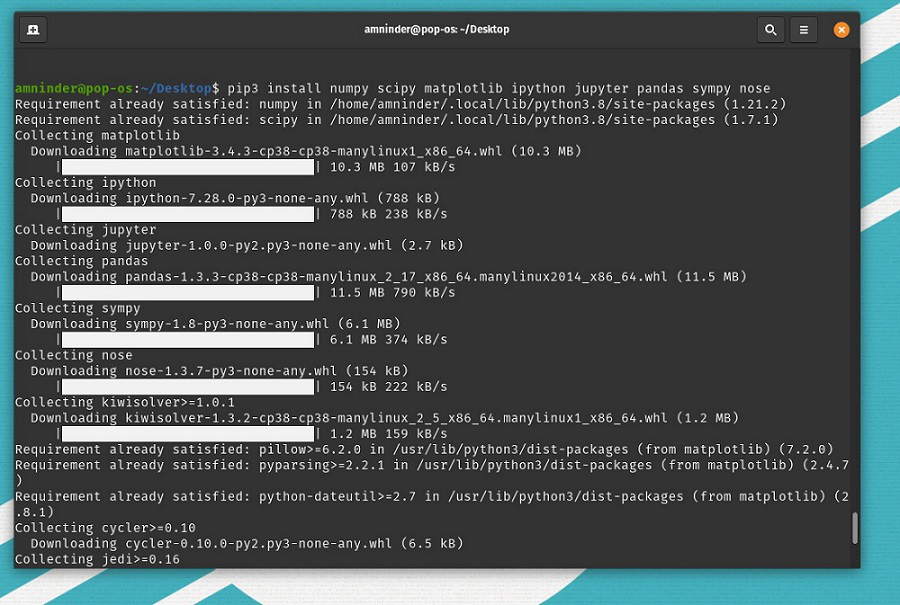
Here's a step-by-step guide on how to install SciPy for Python:
Method 1: Install using pip (Recommended)
pip is the package installer for Python, and it comes bundled with Python. To install SciPy using pip, follow these steps:
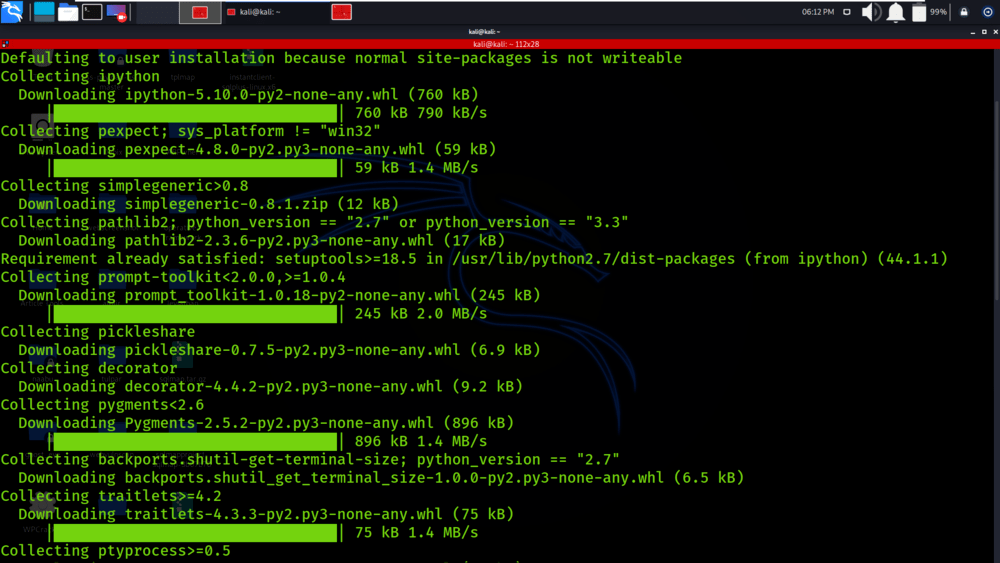
Make sure you have pip installed: If you're not sure if pip is installed, open a terminal or command prompt and typepip --version. If pip is not installed, you can download the installation script from the official Python website. Install SciPy using pip: Type the following command: pip install scipy
This may take a few seconds to complete, depending on your internet connection speed.

Method 2: Install using conda (for Anaconda users)
If you're using Anaconda, you can install SciPy using conda. Here's how:
Open the Anaconda Prompt: If you're using Windows, search for "Anaconda Prompt" in the start menu. If you're on a Mac or Linux, open Terminal.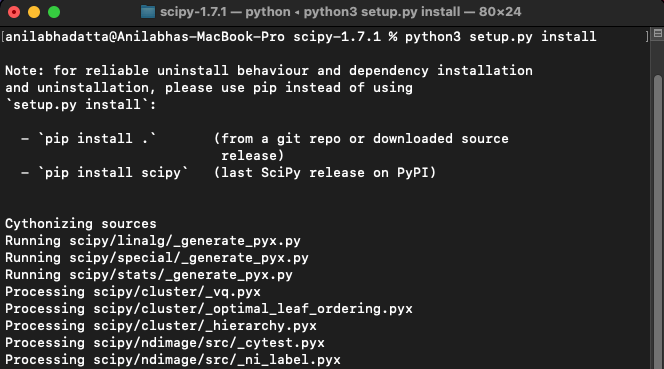
conda install scipy
Method 3: Install from source (for advanced users)
If you want to compile SciPy from scratch, follow these steps:
Download the SciPy source code: Go to the official SciPy website and download the source code. Unpack the source code: Unzip the downloaded file using your preferred compression software. Install the necessary dependencies: SciPy requires NumPy, which is also a Python package. Make sure you have NumPy installed before installing SciPy from source. You can install NumPy using pip:pip install numpy Compile and install SciPy: Navigate to the folder containing the unpacked SciPy source code, then run the following command: python setup.py build (this step may take a while) Install SciPy: Once the build process is complete, run the following command: python setup.py install
Troubleshooting Tips
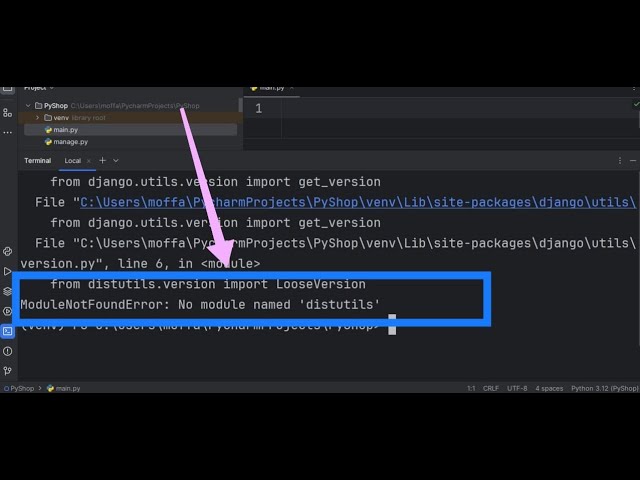
If you encounter errors during installation, try updating pip or reinstalling Python. Make sure you have sufficient disk space and available memory for the installation process. If you're installing from source, ensure that you have all the necessary dependencies installed.That's it! Once you've successfully installed SciPy, you can use the import scipy statement in your Python code to start using its features.
How to implement SciPy in Python?

To implement SciPy (Scientific Python) in your Python project, you can follow these steps:
Install SciPy: SciPy is a library that needs to be installed separately from the Python interpreter. You can install it using pip, which is Python's package installer, by running the following command:pip install scipy
import scipy
This will give you access to all the functions and modules provided by SciPy.
Explore SciPy Modules: SciPy provides several modules that deal with specific areas of scientific computing, such as:scipy.stats: for statistical analysis scipy.optimize: for optimization techniques scipy.integrate: for numerical integration and differentiation scipy.signal: for signal processing and filtering scipy.linalg: for linear algebra operations
For example, to use the stats module, you would import it specifically:
from scipy.stats import norm
norm.pdf() function from the scipy.stats module. To perform linear regression, you can use the curve_fit() function from the scipy.optimize module.
Here's an example of using SciPy to perform linear regression:
from scipy.optimize import curve_fit
import numpy as np
Define a function that represents the relationship between x and y
def func(x, p):
return p[0] * x + p[1]
Generate some data points
x = np.array([0., 1., 2., 3., 4.])
y = np.array([2., 3., 5., 7., 11.])
Perform linear regression using curve_fit()
popt, pcov = curve_fit(func, x, y)
print("Coefficients:", popt)
This code uses SciPy's curve_fit() function to perform linear regression on a set of data points and prints the estimated coefficients.
import numpy as np
import matplotlib.pyplot as plt
Generate some data
x = np.linspace(0, 10, 100)
y = np.sin(x)
Plot the data using SciPy's signal processing functions
from scipy.signal import savgol_filter
y_filtered = savgol_filter(y, window_length=51, polyorder=3)
plt.plot(x, y, label='Original')
plt.plot(x, y_filtered, label='Filtered')
plt.legend()
plt.show()
This code uses SciPy's savgol_filter() function to apply a Savitzky-Golay filter to the generated data and then plots both the original and filtered signals using Matplotlib.
By following these steps and exploring the various modules and functions provided by SciPy, you can effectively implement it in your Python project and perform advanced scientific computing tasks.


