How do I install matplotlib in Python?
How do I install matplotlib in Python?
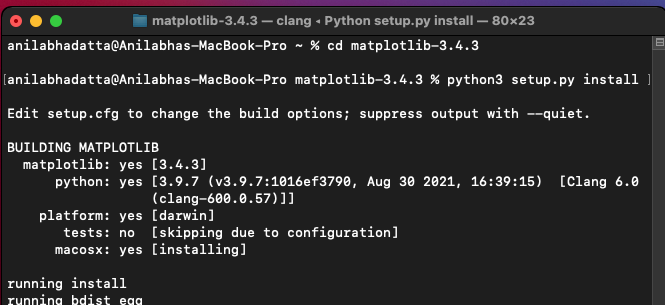
Installing Matplotlib in Python is a straightforward process that can be completed with just a few simple steps. Here's a step-by-step guide on how to install Matplotlib:
Prerequisites:
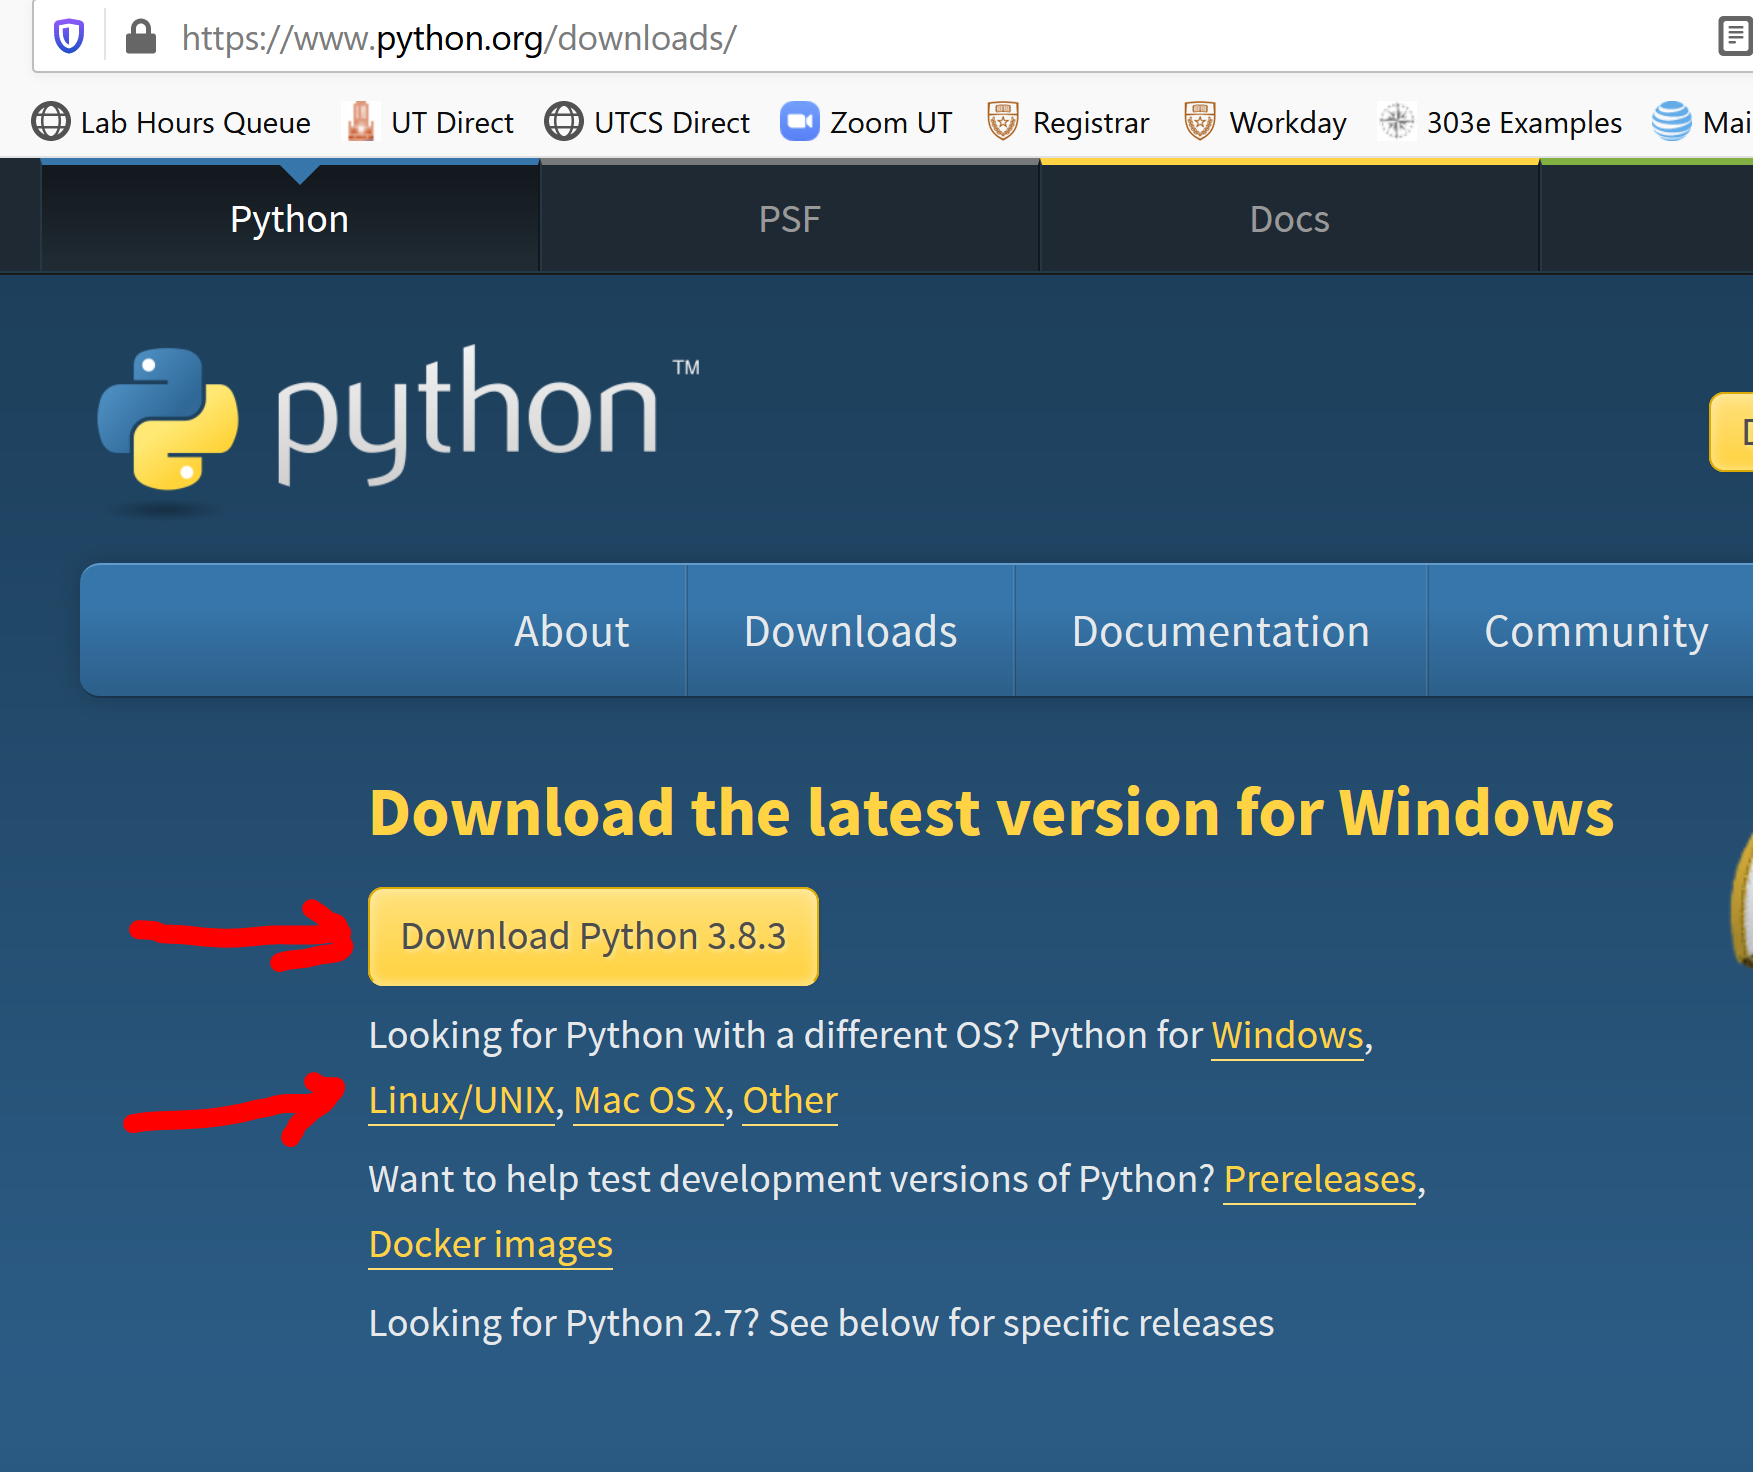
Python: You need to have Python installed on your system. If you don't have Python installed, you can download the latest version from the official Python website. pip: pip is the package installer for Python. It's usually included with Python installations.Step 1: Install Matplotlib using pip
Open a terminal or command prompt and type the following command:
pip install matplotlib
This will start installing Matplotlib and its dependencies. Depending on your internet connection, this may take a few seconds to several minutes.
Step 2: Verify the installation (optional)
If you want to verify that Matplotlib has been installed successfully, you can open a new Python interpreter or IDE (Integrated Development Environment) like PyCharm, Visual Studio Code, or Spyder. Then, type:
import matplotlib.pyplot as pltprint(plt.version)
This should print the version number of Matplotlib, indicating that it has been installed correctly.
Alternative installation methods:
If you're using a Linux-based system (like Ubuntu or Fedora) or macOS, you can also install Matplotlib using package managers like apt-get or homebrew. For example:
sudo apt-get install python3-matplotlib # (Ubuntu-based systems)
or
brew install matplotlib # (macOS using Homebrew)
Troubleshooting tips:
Error messages: If you encounter errors during installation, make sure that pip is updated to the latest version by runningpip install --upgrade pip. Dependency issues: Some users may experience dependency issues while installing Matplotlib. You can try upgrading the required dependencies using pip install --upgrade numpy scipy before attempting to reinstall Matplotlib. Python version compatibility: Matplotlib supports Python 3.6 and later versions. If you're using an earlier version of Python, you might need to upgrade or use a compatible version.
Conclusion:
Installing Matplotlib in Python is a breeze! By following these simple steps, you should be able to get started with creating stunning visualizations and data-driven insights. Remember to verify the installation (if you're curious) and troubleshoot any issues that may arise during the process. Happy plotting!
What is NumPy and matplotlib in Python?
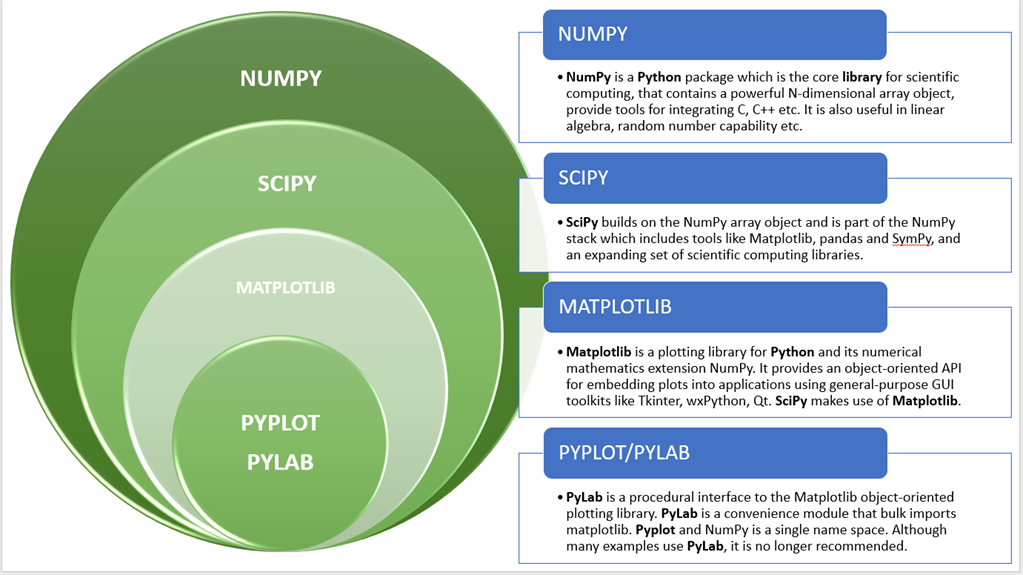
NumPy (Numerical Python) and Matplotlib are two fundamental libraries in the Python programming language.
What is NumPy?
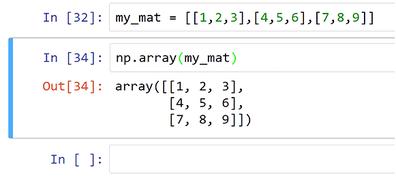
NumPy is a library for working with arrays and mathematical operations in Python. It provides support for large, multi-dimensional arrays and matrices, and it is particularly well-suited to efficient numerical computation. NumPy's primary features include:
N-dimensional arrays: NumPy's core data structure is the N-dimensional array, which can be thought of as a vector or matrix. Matrix operations: NumPy provides functions for performing various matrix operations, such as matrix multiplication, solving systems of linear equations, and computing eigenvalues and eigenvectors. Random number generation: NumPy includes support for generating random numbers and random matrices. Linear algebra routines: NumPy contains a range of linear algebra routines, including singular value decomposition (SVD), eigenvalue decomposition (EVD), and Cholesky decomposition.NumPy is widely used in the Python community because it allows developers to quickly and easily perform numerical operations, making it an essential tool for scientific computing, data analysis, machine learning, and more.
What is Matplotlib?
Matplotlib is a plotting library for creating static, animated, and interactive visualizations in Python. It is often used alongside NumPy for data visualization and graphical representation of data. Matplotlib's primary features include:
2D and 3D plots: Matplotlib allows you to create a wide range of 2D and 3D plots, such as line plots, scatter plots, histograms, bar charts, and more. Customizable plots: You can customize the appearance of your plots by modifying various parameters, such as axis labels, titles, fonts, colors, and more. Interactive plots: Matplotlib provides tools for creating interactive visualizations that allow users to zoom in/out, pan, and hover over data points. Output formats: Matplotlib supports outputting plots to a variety of formats, including PNG, PDF, EPS, and SVG.Matplotlib is an excellent tool for data scientists and researchers who need to visualize complex datasets or communicate findings effectively with stakeholders.
Combining NumPy and Matplotlib
When used together, NumPy and Matplotlib can be incredibly powerful. For example, you might use NumPy to perform calculations on large datasets, then use Matplotlib to visualize the results as plots, charts, or other graphical representations.
Here's a simple example:
import numpy as np
import matplotlib.pyplot as plt
Generate some random data using NumPy
x = np.random.rand(100)
y = np.random.rand(100)
Plot the data using Matplotlib
plt.scatter(x, y)
Customize the plot by adding labels and titles
plt.xlabel('X-axis')
plt.ylabel('Y-axis')
plt.title('Random Data')
Save the plot to a file (PNG format) or display it interactively
plt.show()
In this example, NumPy is used to generate some random data, while Matplotlib is used to create a scatter plot of that data and customize its appearance. This is just one simple demonstration of how these two libraries can be combined to achieve powerful results.
In conclusion, NumPy and Matplotlib are two essential tools in the Python ecosystem for numerical computing and data visualization. They are widely used in many areas, including scientific computing, data analysis, machine learning, and more.
