Python data visualization matplotlib
Python data visualization matplotlib
Here is a detailed explanation of using Python's popular data visualization library, Matplotlib:
Matplotlib is a widely-used plotting library for creating high-quality 2D and 3D plots. It's particularly well-suited for exploring and visualizing large datasets in various fields such as scientific research, finance, and data analysis.
Key Features:
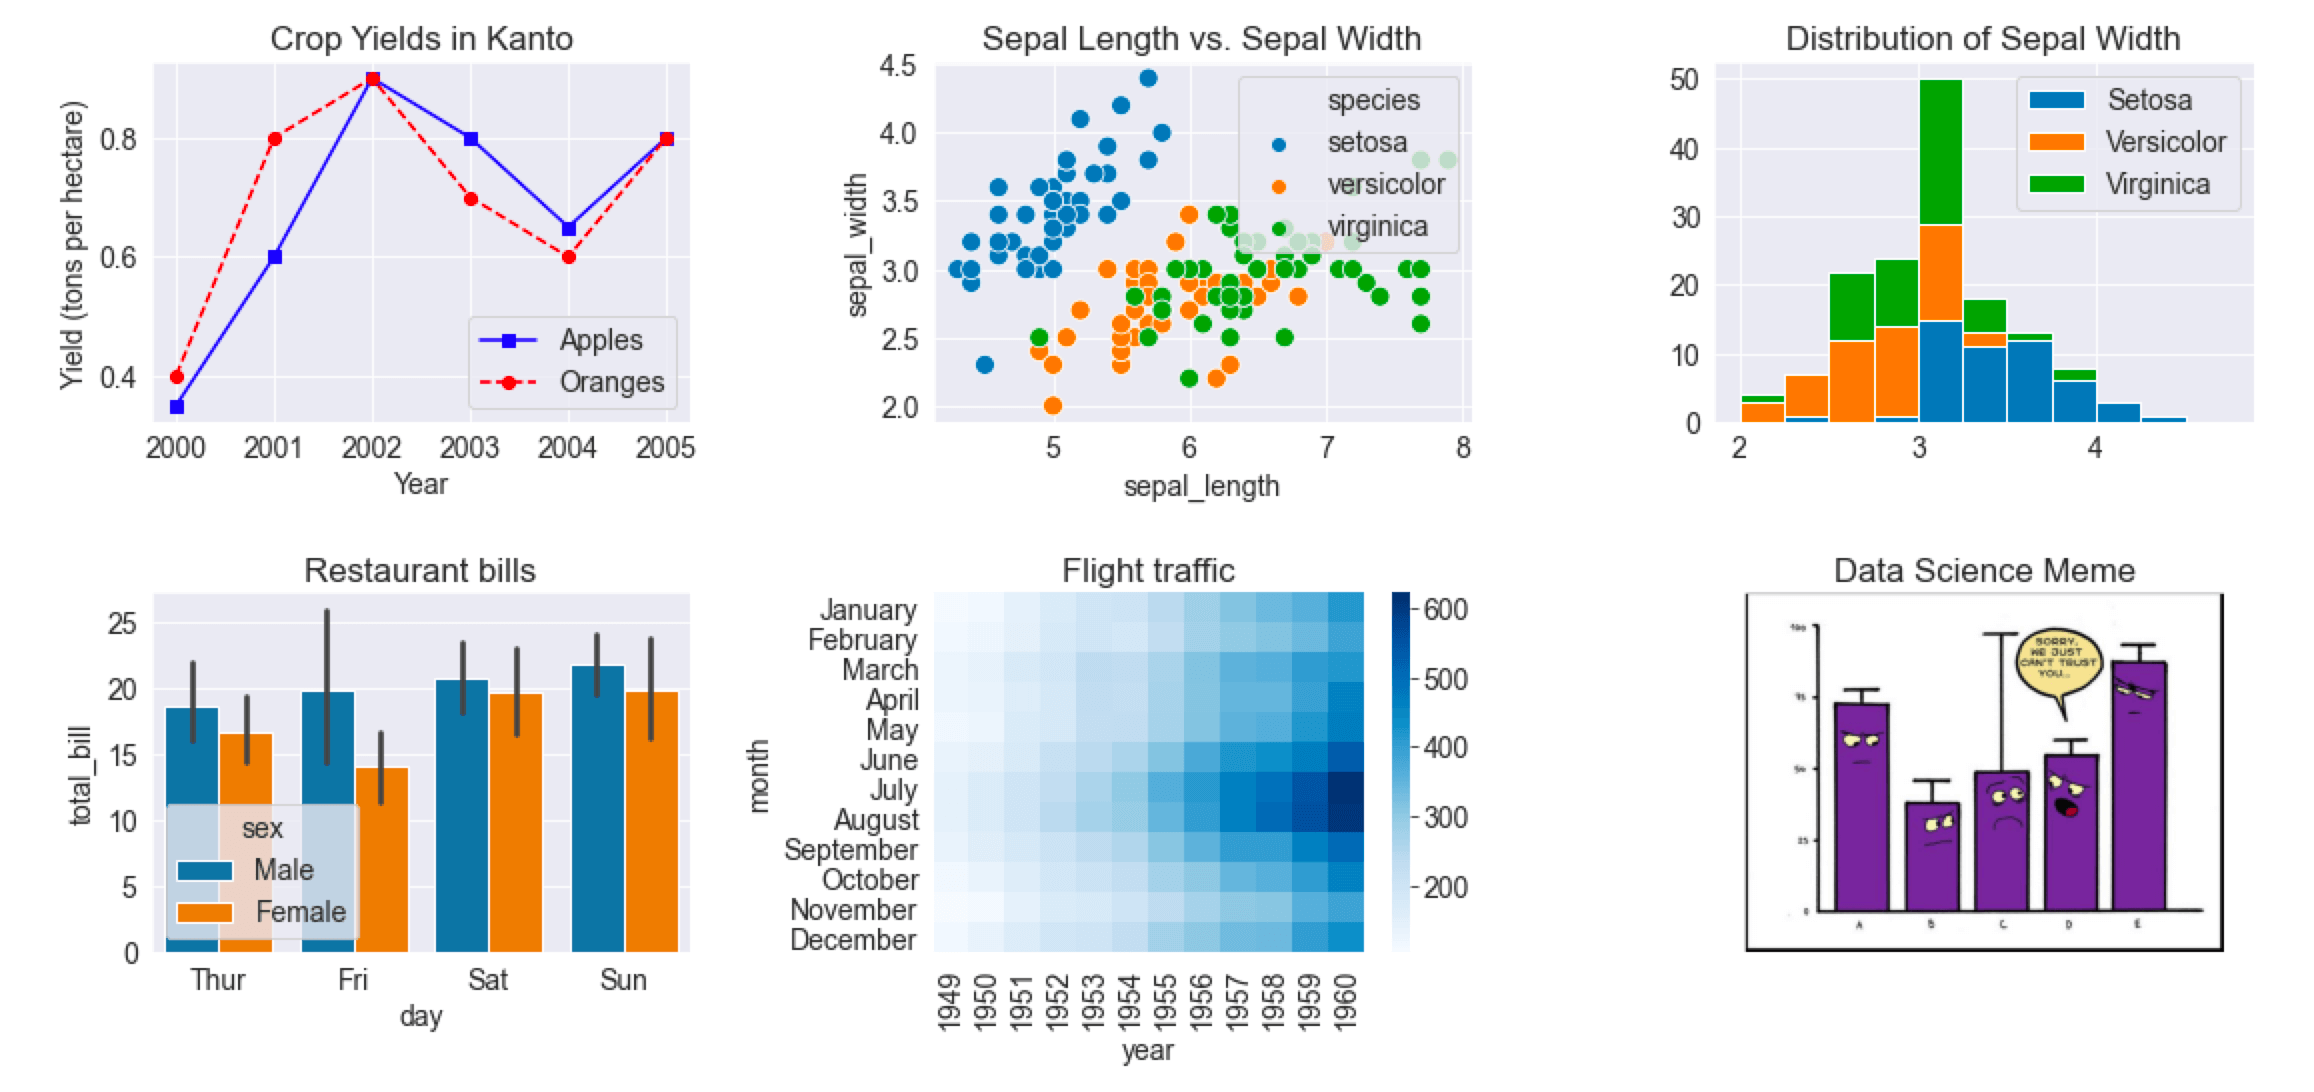
Plotting: Matplotlib allows you to create a wide range of plot types, including: Line plots Scatter plots Bar charts Histograms Heatmaps Contour plots 3D plots (e.g., surfaces, wires, and scatter plots) Customization: Matplotlib provides extensive control over plot appearance, including: Colors and color maps Fonts and text styles Line styles and widths Marker types and sizes Axis labels and titles Interactivity: Matplotlib supports interactive plotting tools like zooming, panning, and hover-over displays. Integration: Matplotlib can be easily integrated with other Python libraries and frameworks, such as NumPy, Pandas, and Scikit-Learn.Basic Usage:
To get started, you'll need to install Matplotlib using pip or conda:
pip install matplotlib
Once installed, you can start creating plots by importing the library and using its various functions. Here's a simple example:
import matplotlib.pyplot as plt Create some sample datax = [1, 2, 3, 4, 5]
y = [1, 4, 9, 16, 25]
Create the plotplt.plot(x, y)
Show the plotplt.show()
In this example, we're creating a simple line plot using plt.plot() and displaying it with plt.show().
Tips and Tricks:
Use a consistent style: For professional-looking plots, consider setting a consistent font size, axis label format, and color scheme throughout your figures. Label axes carefully: Make sure to provide clear and concise labels for both the x-axis and y-axis to help readers understand what they're looking at. Use interactive tools: Explore Matplotlib's built-in interactivity features, such as zooming and panning, to enhance your visualizations. Experiment with different plot types: Don't be afraid to try out different plot types (e.g., scatter plots for non-linear relationships) to find the best visualization strategy for your data.Real-World Applications:
Scientific research: Use Matplotlib to create complex plots that visualize scientific data, such as climate patterns or population dynamics. Data analysis: Leverage Matplotlib's customization options to create informative and visually appealing reports on financial trends, social media metrics, or other types of data. Education: Utilize Matplotlib to illustrate key concepts in various fields, such as physics, biology, or economics.By mastering Python's popular data visualization library, Matplotlib, you'll be able to effectively communicate insights from your data and create stunning visualizations that captivate audiences.
I hope this helps! Let me know if you have any questions.
Data visualization in Python using Matplotlib
Data Visualization in Python using Matplotlib: A Comprehensive Guide
As a data scientist, visualizing data is an essential step in the analysis process. It helps us to identify patterns, trends, and correlations that might not be immediately apparent from looking at raw numbers or tables. In this tutorial, we will explore how to use Python's popular Matplotlib library for data visualization.
What is Matplotlib?
Matplotlib is a plotting library for Python that provides a comprehensive set of tools for creating high-quality 2D and 3D plots. It is often used in conjunction with other popular libraries such as NumPy, Pandas, and Scikit-learn. With Matplotlib, you can create a wide range of plot types, including line plots, scatter plots, histograms, box plots, and more.
Basic Plotting
To get started with Matplotlib, you'll need to import the library and specify the type of plot you want to create:
import matplotlib.pyplot as plt
Example: Create a simple line plot
x = [1, 2, 3, 4, 5]
y = [2, 4, 6, 8, 10]
plt.plot(x, y)
plt.show()
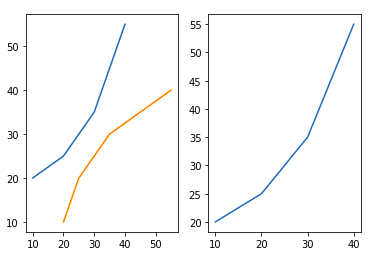
This code will create a simple line plot with the x-axis on the bottom and the y-axis on the left. The plot() function takes two arrays of numbers as input: the x-values and the corresponding y-values.
Customizing Plots
Matplotlib offers many ways to customize your plots, including:
Titles: Add a title to your plot using thetitle() method:
plt.title("My Plot")
xlabel() and ylabel() methods:
plt.xlabel("X-axis")
plt.ylabel("Y-axis")
legend() method:
plt.legend(["Line 1", "Line 2"])
plot() function's color argument:
plt.plot(x, y, 'r') # Red line
More Advanced Plotting
Matplotlib also provides many advanced features for creating more complex plots:
Subplots: Create multiple subplots on a single figure using thesubplots() function:
fig, axes = plt.subplots(2, 2)
Plot something on each subplot...
plot3d() and plot_surface() functions:
import numpy as np
x = np.linspace(0, 10)
y = np.linspace(0, 10)
X, Y = np.meshgrid(x, y)
fig = plt.figure()
ax = fig.add_subplot(111, projection='3d')
ax.plot_surface(X, Y, X2 + Y2)
Best Practices
When working with Matplotlib, it's a good idea to follow these best practices:
Use theion() function: Use this function to create an interactive plot that updates in real-time:
plt.ion()
show() function: Call this function to display your plot:
plt.show()
close() method to avoid memory leaks:
fig = plt.figure()
fig.close()
In conclusion, Matplotlib is a powerful library for creating high-quality data visualizations in Python. With its comprehensive set of tools and features, you can create a wide range of plots to help you explore and communicate your data effectively. Happy plotting!
