What is Python folium?
What is Python folium?
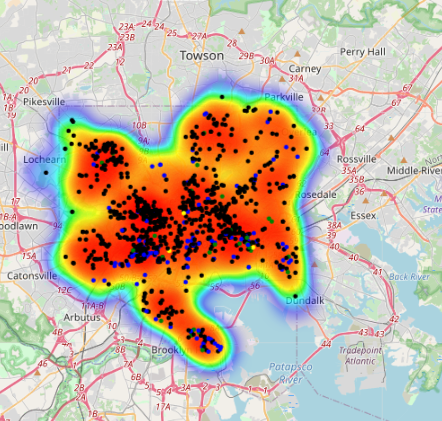
I'm glad you asked! Folium is a fantastic open-source library for Python that allows you to create interactive maps with various markers, pop-ups, and overlays. In other words, it's a powerful tool for visualizing geospatial data in Jupyter Notebooks or other Python environments.
Folium is built on top of the popular Leaflet.js library, which provides an efficient and customizable way to create dynamic map visualizations. By combining Folium with your favorite Python libraries (like Pandas, NumPy, or Scikit-learn), you can quickly analyze and visualize large datasets containing geographic information.
With Folium, you can:
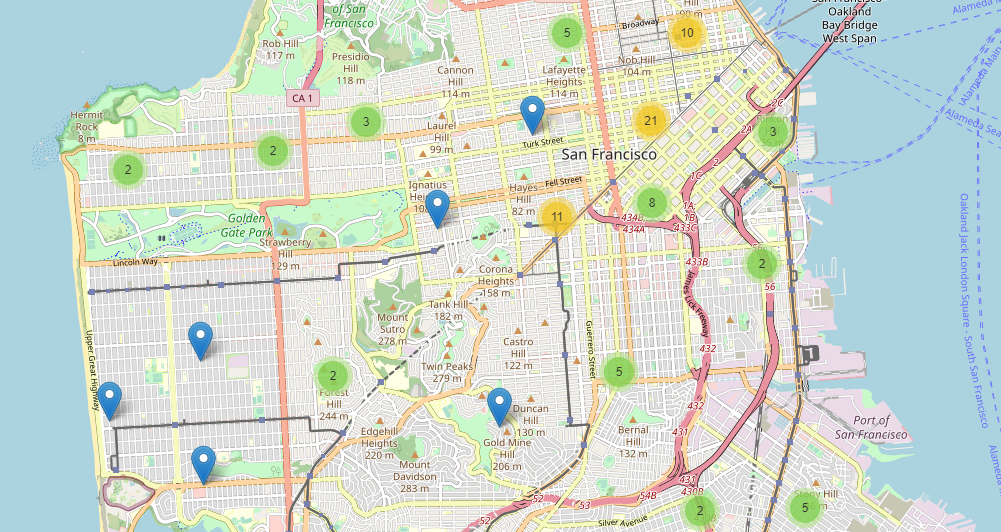
Folium supports many popular geospatial formats, such as GeoJSON, TopoJSON, and Shapefiles, making it easy to integrate with your existing data sources.
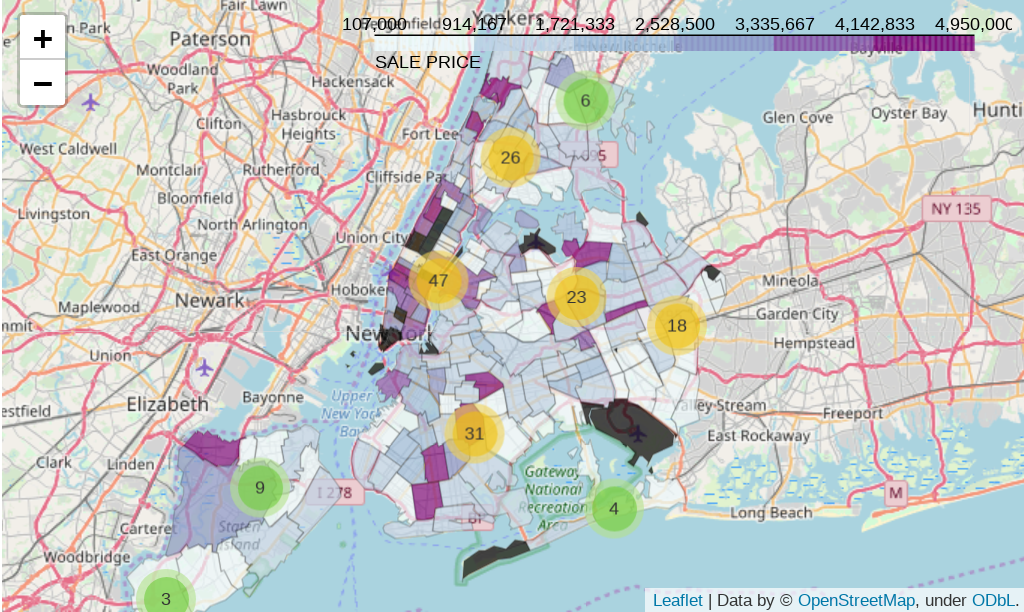
Some examples of what you can create with Folium include:
Interactive maps for storytelling or education Business intelligence dashboards showing sales data or customer locations Environmental monitoring systems displaying pollution levels or weather patterns Travel guides highlighting attractions, restaurants, or hotelsThe best part? Folium is highly extensible and can be customized using various libraries like Bokeh, Plotly, or even D3.js. This means you can seamlessly integrate Folium with your existing visualization workflow.
In conclusion, Folium is a fantastic Python library for creating engaging, interactive maps that help you tell stories, analyze data, or simply showcase geographic information in an attractive and meaningful way.
Can I plot a map in Python?
Yes, you can definitely plot a map in Python using various libraries and tools available. In fact, plotting maps is a popular application of geospatial data processing and visualization.
Python has several libraries that can help you with mapping tasks. Here are some of the most popular ones:
Basemap: This is one of the earliest and widely used libraries for creating static maps in Python. It provides an easy-to-use API to create various types of maps, including those with markers, polygons, and more. Cartopy: Cartopy is a more recent library that's specifically designed for creating interactive, web-based maps. It's built on top of Matplotlib and has many features for customizing map visuals. Folium: Folium is another popular library for creating interactive maps in Python. It's particularly useful for visualizing large datasets and supports various map projections. Geopandas: Geopandas is a library that allows you to easily work with geospatial data (e.g., shapefiles, GeoJSON) within the familiar Pandas ecosystem.To get started with mapping in Python, you'll typically need to:
Install the desired library using pip (e.g.,pip install cartopy). Load your geospatial data into a suitable format (e.g., shapefile, CSV with coordinates). Create a figure or plot using Matplotlib and/or the chosen mapping library. Customize the map as needed by adding markers, polygons, or other visual elements.
Here's a simple example of how you can create a static map using Basemap:
import matplotlib.pyplot as plt
from mpl_toolkits.basemap import Basemap
Create a new Basemap instance with the Mercator projection
m = Basemap(projection='mill', lat_0=40, lon_0=-100)
Load the world map (note: this might take some time)
m.readshapefile('world', 'world')
Set up the plot area
ax = m.ax
Add some coastlines and grid lines
m.drawcoastlines()
m.fillcontinents(color='blue')
m.drawmapboundary()
plt.show()
This code snippet creates a simple world map with the Basemap library. You can customize this example to suit your needs or explore other libraries like Cartopy or Folium for more advanced mapping tasks.
Keep in mind that these are just brief introductions, and there's much more to learn about mapping in Python. I hope this helps get you started on your geospatial journey!
