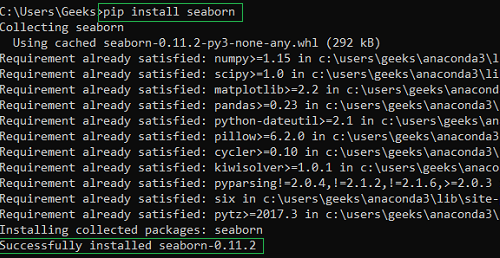
Is seaborn a Python package?
Is seaborn a Python package?
Yes, Seaborn is indeed a Python package. It's a powerful data visualization library built on top of Matplotlib, which itself is based on NumPy and SciPy.
Seaborn provides a high-level interface for drawing attractive and informative statistical graphics. The main goals are to create a set of tools that can be used by researchers to quickly and easily visualize the results of their analyses, as well as to provide a simple way to create beautiful-looking plots that can be used in research papers or presentations.
Seaborn is built on top of Matplotlib and Pandas, which allows it to tap into the extensive range of features provided by these libraries. This means that Seaborn has access to the same graphics capabilities as Matplotlib, allowing users to easily create custom plots that suit their needs.
Some of the key features of Seaborn include:
High-level interface: Seaborn provides a simple and intuitive way to create complex statistical graphics, making it easy for researchers without extensive programming knowledge to quickly produce high-quality plots. Data visualization tools: Seaborn includes a range of data visualization tools that can be used to quickly and easily visualize the results of statistical analyses, including scatterplots, box plots, heatmaps, and more. Support for multiple plotting interfaces: Seaborn allows users to create plots using either Matplotlib's API or its own high-level interface, making it easy to switch between the two depending on the specific needs of the project. Integration with Pandas: Seaborn is designed to work seamlessly with Pandas data structures, allowing users to easily import and manipulate data from external sources before visualizing it.Some common use cases for Seaborn include:
Data analysis and visualization: Seaborn is particularly well-suited for tasks that involve analyzing large datasets and creating plots to visualize the results. Research papers and presentations: Seaborn's ability to create attractive and informative statistical graphics makes it a popular choice for researchers looking to present their findings in a visually appealing way. Education: Seaborn's ease of use and high-level interface make it an excellent tool for teaching data analysis and visualization concepts to students.In conclusion, Seaborn is indeed a Python package that provides a powerful set of tools for creating attractive and informative statistical graphics. Its ability to integrate with other popular libraries like Matplotlib and Pandas makes it an essential tool for any researcher or data analyst looking to gain insights from their data.
What is import seaborn in Python?
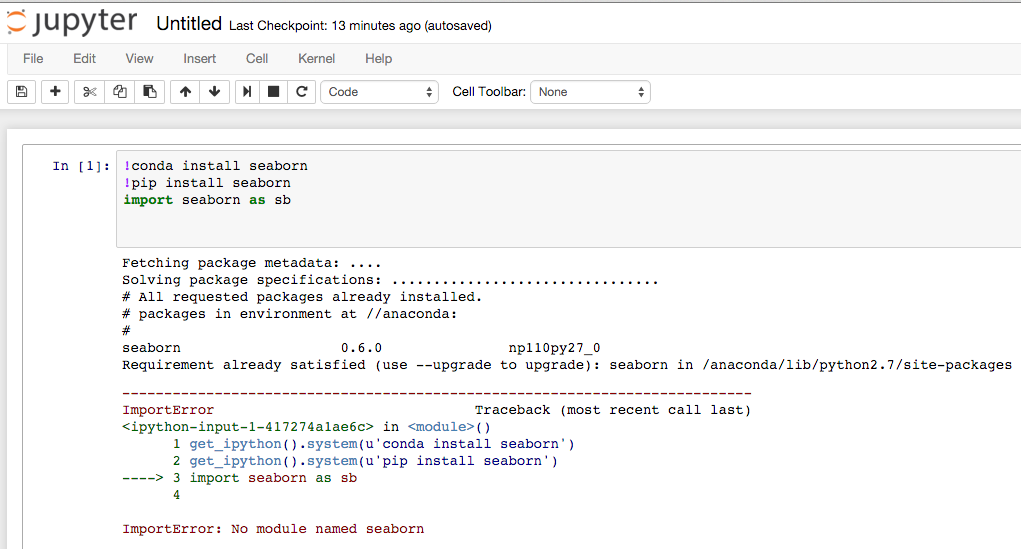
I'd be happy to explain what import seaborn means in Python!
In Python, seaborn is a popular data visualization library that relies on the power of matplotlib and numpy. It was inspired by the R plotting system called ggplot2. When you say import seaborn, it means you are bringing the seaborn library into your current Python script or program.
Seaborn allows you to create informative and attractive statistical graphics, particularly for exploring and presenting data. This library provides a high-level interface for creating plots and charts that are easy to customize and extend. Some of the key features of seaborn include:
Visualization of statistical data: Seaborn is perfect for creating various types of plots like scatterplots, line plots, boxplots, histograms, and more.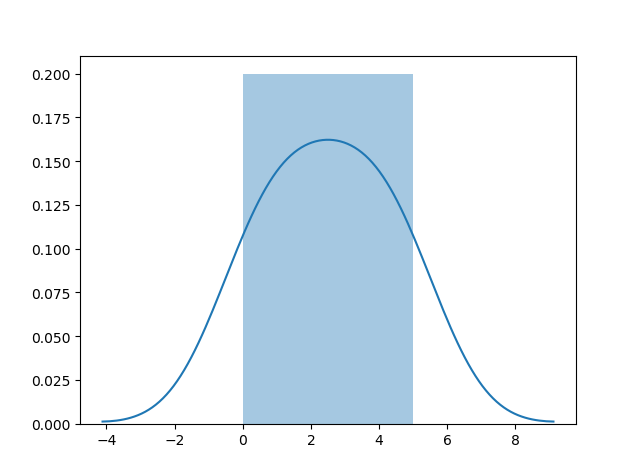
sns.heatmap() and sns.pairplot().
Some common use cases for using seaborn include:
Exploratory Data Analysis (EDA): Seaborn is fantastic for discovering relationships between variables, identifying patterns in your data, and getting a deeper understanding of the data distribution. Data visualization: Whether you're building reports or presenting findings to stakeholders, seaborn can help create professional-grade visualizations that are both informative and engaging. Scientific publications: Seaborn is commonly used for publishing research results in scientific papers and journals, as it allows authors to effectively communicate their findings using visually appealing plots.To give you a better idea of what seaborn is capable of, here's an example code snippet:
import pandas as pd
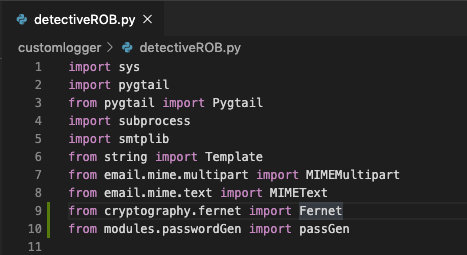
import seaborn as sns
Load the dataset
df = pd.read_csv("your_data.csv")
Create a scatterplot with seaborn
sns.set()
plt.figure(figsize=(8, 6))
sns.scatterplot(x="x_axis", y="y_axis", data=df)
plt.show()
This code loads a CSV file into a pandas DataFrame and then uses seaborn to create a scatter plot based on the x and y axes. You can customize the appearance of this plot by modifying various parameters.
In summary, importing seaborn in Python allows you to leverage its powerful features for creating informative and visually appealing statistical graphics, making it an essential tool for any data scientist or analyst!
